
The correctly labeled graph for a land market.
Explanation of Solution
Graph of the land market can be drawn as follows:
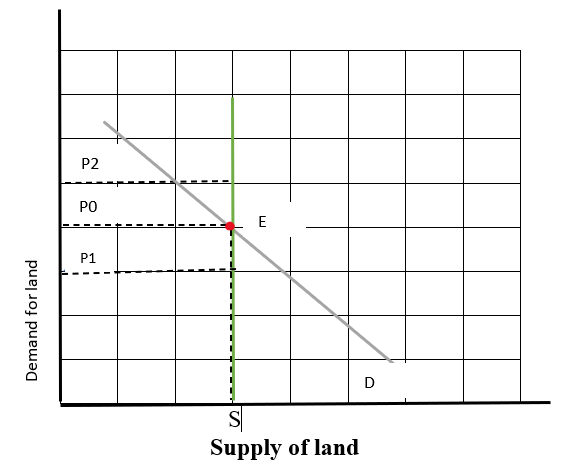
Supply of land
The quantity supplied is represented on the horizontal axis of the graph and demand for the land at a particular price or rental rate is shown on the vertical axis of the graph.
As the supply of land is fixed, therefore, the supply curve is a straight vertical line but the demand curve is on a downward slope, which means the decrease in the price of land lead to more demand for land.
The equilibrium rental rate of the land is at the point of P0 and the
Introduction: When the quantity demanded and supply of goods are equal, this situation is called
Chapter 70 Solutions
Krugman's Economics For The Ap® Course


 Principles of Economics (12th Edition)EconomicsISBN:9780134078779Author:Karl E. Case, Ray C. Fair, Sharon E. OsterPublisher:PEARSON
 Engineering Economy (17th Edition)EconomicsISBN:9780134870069Author:William G. Sullivan, Elin M. Wicks, C. Patrick KoellingPublisher:PEARSON
 Principles of Economics (MindTap Course List)EconomicsISBN:9781305585126Author:N. Gregory MankiwPublisher:Cengage Learning
 Managerial Economics: A Problem Solving ApproachEconomicsISBN:9781337106665Author:Luke M. Froeb, Brian T. McCann, Michael R. Ward, Mike ShorPublisher:Cengage Learning
 Managerial Economics & Business Strategy (Mcgraw-...EconomicsISBN:9781259290619Author:Michael Baye, Jeff PrincePublisher:McGraw-Hill Education