
Concept explainers
Videos
(a)
To test: Whether the ‘friends on Facebook’ data is skewed or not by using appropriate graph.
(a)
Answer to Problem 26E
Solution: The data is positively skewed.
Explanation of Solution
Graph: To find whether data is skewed or not, the histogram can be drawn. To draw the histogram, follow the below mentioned steps in Minitab;
Step 1: Enter the data in Minitab and enter variable name as ‘Number of Facebook friend’.
Step 2: Go to
Step 3: In dialog box that appears select ‘friends on Facebook’ under the field marked as ‘Graph variable’. Then click Ok.
The histogram is as follows;
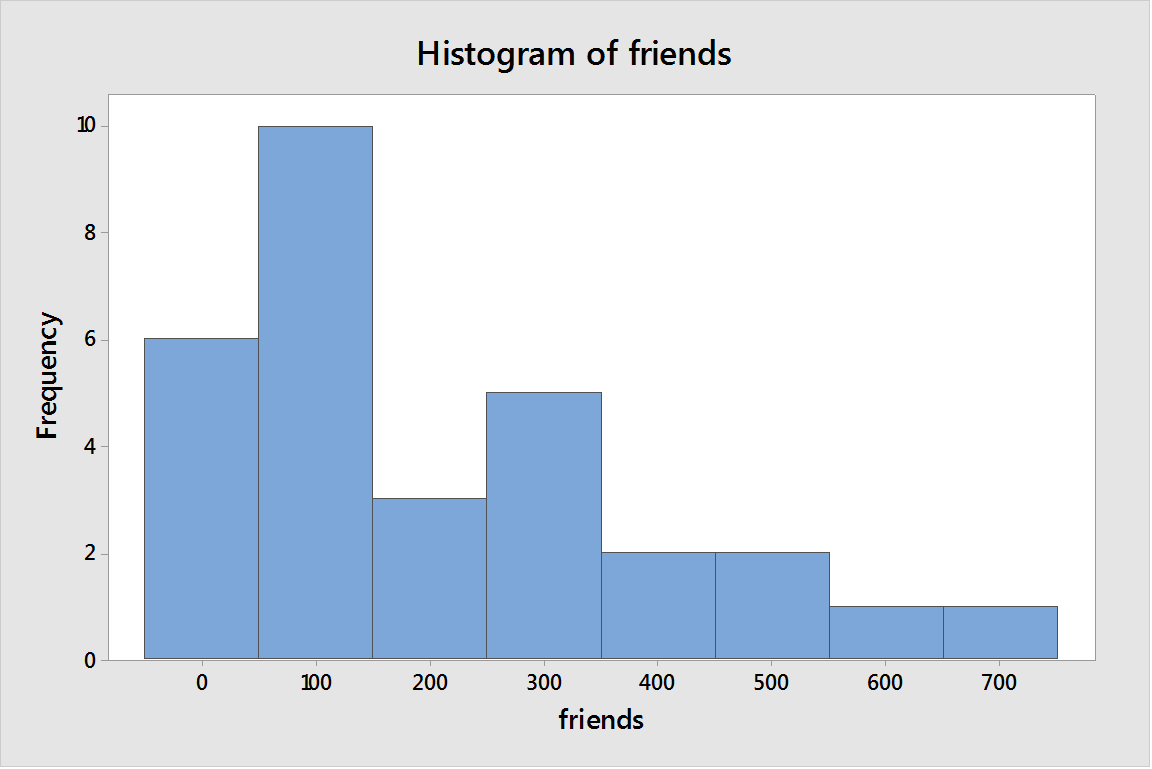
Conclusion: In above graph, it can be seen that most of the frequencies are distributed in right hand side of the highest frequency. Hence, the data is positively skewed.
To explain: The findings.
Answer to Problem 26E
Solution: The
Explanation of Solution
The most frequent any value is between 100 and 200 and most of the frequencies are distributed on the right hand side of this so the distribution is positively skewed.
(b)
To explain: Whether t method should be used to calculate 95% confidence interval for mean.
(b)
Answer to Problem 26E
Solution: No, t method should be used to calculate confidence interval.
Explanation of Solution
There is an assumption for using t test that the population distribution must be
(c)
Section 1:
To find: The mean number of Facebook friends for sample.
(c)
Section 1:
Answer to Problem 26E
Solution: The sample mean is 205.3 (approximated to 205) friends.
Explanation of Solution
Calculation: To calculate the sample mean follow the below mentioned steps in Minitab;
Step 1: Enter the data in Minitab and enter variable name as ‘Number of Facebook friends’.
Step 2: Go to
Step 3: In dialog box that appears select ‘friends’ under the field marked as ‘Variables’. Then click on ‘Statistics’.
Step 4: In dialog box that appears select ‘None’ and then ‘Mean’. Finally click ‘Ok’ on both dialog boxes.
From Minitab result, the mean is 205.3 but number of friends is an integer value. So mean can never be a decimal value. Therefore, the nearest integer value will be 205. Hence the mean number of friend will be 205 friends.
Section 2:
To find: The standard deviation of Facebook friends for sample.
Section 2:
Answer to Problem 26E
Solution: The standard deviation is 196.3 (approximated to 196) friends.
Explanation of Solution
Calculation: To calculate the standard deviation follow the below mentioned steps in Minitab;
Step 1: Follow the step 1 to 3 performed in section 1 of part (b).
Step 2: In dialog box that appears select ‘None’ and then ‘standard deviation’. Finally click ‘Ok’ on both dialog boxes.
From Minitab result, the standard deviation is196.3 friends but number of friends is an integer value. So it can never be a decimal value and the nearest integer value will be 196. Hence the standard deviation of the number of friends will be 196 friends.
Section 3:
To find: The standard error of Facebook friends for sample.
Section 3:
Answer to Problem 26E
Solution: The standard error is 35.8 (approximated to 36) friends.
Explanation of Solution
Calculation: To calculate the standard error follow the below mentioned steps in Minitab;
Step 1: Follow the step 1 to 3 performed in section 1 of part (b).
Step 2: In dialog box that appears select ‘None’ and then ‘SE of mean’. Finally, click ‘Ok’ on both dialog boxes.
From Minitab result, the standard error is35.8 friends but the number of friends is an integer value. So the standard error can never be a decimal value. Therefore, the nearest integer value will be 36. Hence the standard deviation of the number of friends will be 36 friends.
Section 4:
To find: The margin of error for Facebook friends.
Section 4:
Answer to Problem 26E
Solution: The margin of error is 110.005 (approximated to 110) friends.
Explanation of Solution
Calculation: The formula to calculate the margin of error is as follows,
Where
Hence the margin of error is73.2996 friends but the number of friends is an integer value. So the standard error can never be a decimal value. Therefore, the nearest integer value will be 73. Hence the margin of error will be 73 friends.
(d)
To find: 95% confidence interval for data of friends on Facebook.
(d)
Answer to Problem 26E
Solution: The required confidence interval is
Explanation of Solution
Calculation: The confidence interval is an interval for which there is 95% chances that it contains the population parameter (population mean).
To calculate confidence interval, follow the below mentioned steps in Minitab;
Step 1: Enter the provided data into Minitab and enter variable name as ‘Number of Facebook friend’.
Step 2: Go to
Step 3: In the dialog box that appears select ‘Number of Facebook friends’ under the field marked as ‘Sample in columns’. Click on ‘option’.
Step 4: In the dialog box that appears, enter ‘95.0’ under the field marked as ‘Confidence level’ and select ‘not equal’ in ‘Alternative hypothesis’.
From Minitab results 95% confidence interval is (132.0, 278.6) . but the number of friends is an integer value. So the limits of confidence interval can never be a decimal value. Hence the nearest integer value will be 132 and 279. Therefore, the confidence interval of the number of friends will be
Want to see more full solutions like this?
Chapter 7 Solutions
INTRO.TO PRACTICE STATISTICS-ACCESS


 Glencoe Algebra 1, Student Edition, 9780079039897...AlgebraISBN:9780079039897Author:CarterPublisher:McGraw Hill