Confidence Intervals. In Exercises 9–24, construct the confidence interval estimate of the mean . 19. Mercury in Sushi An FDA guideline is that the mercury in fish should be below 1 part per million (ppm). Listed below are the amounts of mercury (ppm) found in tuna sushi sampled at different stores in New York City. The study was sponsored by the New York Times , and the stores (in order) are D’Agostino, Eli’s Manhattan, Fairway, Food Emporium, Gourmet Garage, Grace’s Marketplace, and Whole Foods. Construct a 98% confidence interval estimate of the mean amount of mercury in the population. Does it appear that there is too much mercury in tuna sushi?
Confidence Intervals. In Exercises 9–24, construct the confidence interval estimate of the mean . 19. Mercury in Sushi An FDA guideline is that the mercury in fish should be below 1 part per million (ppm). Listed below are the amounts of mercury (ppm) found in tuna sushi sampled at different stores in New York City. The study was sponsored by the New York Times , and the stores (in order) are D’Agostino, Eli’s Manhattan, Fairway, Food Emporium, Gourmet Garage, Grace’s Marketplace, and Whole Foods. Construct a 98% confidence interval estimate of the mean amount of mercury in the population. Does it appear that there is too much mercury in tuna sushi?
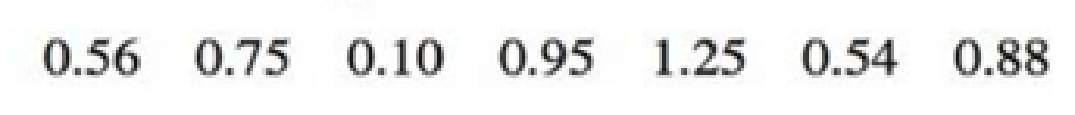
Confidence Intervals. In Exercises 9–24, construct the confidence interval estimate of the mean.
19. Mercury in Sushi An FDA guideline is that the mercury in fish should be below 1 part per million (ppm). Listed below are the amounts of mercury (ppm) found in tuna sushi sampled at different stores in New York City. The study was sponsored by the New York Times, and the stores (in order) are D’Agostino, Eli’s Manhattan, Fairway, Food Emporium, Gourmet Garage, Grace’s Marketplace, and Whole Foods. Construct a 98% confidence interval estimate of the mean amount of mercury in the population. Does it appear that there is too much mercury in tuna sushi?
Definition Definition Method in statistics by which an observation’s uncertainty can be quantified. The main use of interval estimating is for describing a range that is made by transforming a point estimate by determining the range of values, or interval within which the population parameter is likely to fall. This range helps in measuring its precision.
Need a deep-dive on the concept behind this application? Look no further. Learn more about this topic, statistics and related others by exploring similar questions and additional content below.


 Big Ideas Math A Bridge To Success Algebra 1: Stu...AlgebraISBN:9781680331141Author:HOUGHTON MIFFLIN HARCOURTPublisher:Houghton Mifflin Harcourt
 Glencoe Algebra 1, Student Edition, 9780079039897...AlgebraISBN:9780079039897Author:CarterPublisher:McGraw Hill