
Videos
Using Correct Distribution. In Exercises 5–8, assume that we want to construct a confidence interval. Do one of the following, as appropriate: (a) Find the critical value tα/2, (b) find the critical value zα/2 or (c) state that neither the
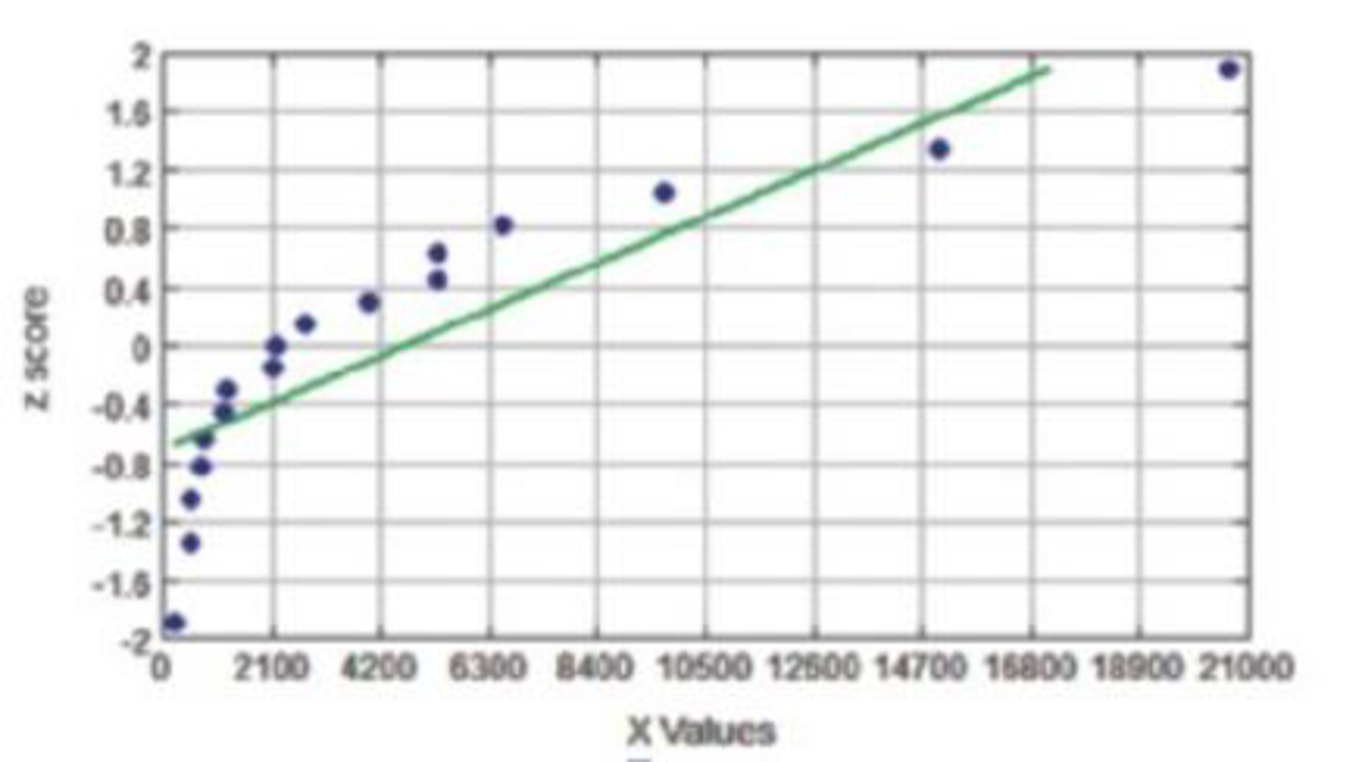
5. Miami Heat Salaries Confidence level is 95%, σ is not known, and the normal quantile plot of the 17 salaries (thousands of dollars) of Miami Heat basketball players is as shown.

Trending nowThis is a popular solution!

Learn your wayIncludes step-by-step video

Chapter 7 Solutions
Elementary Statistics (nasta Edition), 13th Edition
Additional Math Textbook Solutions
Statistics for Psychology
Introductory Statistics
An Introduction to Mathematical Statistics and Its Applications (6th Edition)
Basic Business Statistics, Student Value Edition (13th Edition)
Elementary Statistics: Picturing the World (7th Edition)


- 10 – 11. Margaret, an archeologist, is conducting a test to determine if there is a positive linear relationship between the total height of a dinosaur and its leg length. Her random sample of 15 dinosaur total heights (in feet) and leg lengths (in feet) produced the results shown in the following TI calculator screen. Use the TI calculations in the screen shot to help you answer questions: 10 & 11. LinReg y=a+bx a=28.67845743 b=5.639892354 r=559696513 r=.7481286741 10. What would you predict for a dinosaur's total height (to 2 decimal places) in feet, if the leg length is 5.8 feet? a) 61.39 feet b) 28.68 feet c) 114.99 feet d) 61.33 feet e) 74.81 feet 11. What percent of variation in the dinosaur's total height can be accounted for by the variation in the dinosaur's leg length? a) 28.68% b) 5.64%% c) 55.97% d) 74.81% e) none of thesearrow_forwardThe American Mineralogist (Oct. 2009) published a study of the evolution of uranium minerals in the Earth's crust. Researchers estimate that the trace amount of uranium x in reservoirs follows a uniform distribution ranging between 1 and 3 parts per million. Complete parts a through c. a. Find E(x) and interpret its value. Select the correct answer below and fill in the answer box to complete your choice. (Simplify your answer.) O A. E(X)= This value gives the minimum parts per million of uranium for the collection of all reservoirs on the Earth. O B. E(X)= This value gives the maximum parts per million of uranium for the collection of all reservoirs on the Earth. O C. E(x)= This value gives the mean parts per million of uranium for the collection of all reservoirs on the Earth. O D. E(X)= This value gives the mean parts per million of uranium in each reservoir on the Earth.arrow_forwardIn Exercises 1–5, use the following survey results: Randomly selected subjects were asked if they were aware that the Earth has lost half of its wildlife population during the past 50 years. Among 1121 women, 23% said that they were aware. Among 1084 men, 26% said that they were aware (based on data from a Harris poll). Biodiversity When testing the claim that p1 = p2 , a test statistic of z = −1.64 is obtained. Find the P-value for the hypothesis test.arrow_forward
- 5 c. Test a claim that the mean amount of carbon monoxide in the air in U.S. cities is less than 2.33 parts per million. It was found that the mean amount of carbon monoxide in the air for the random sample of 64 cities is 2.39 parts per million and the standard deviation is 2.12 parts per million. At α=0.10, can the claim be supported? Complete parts (a) through (e) below. Assume the population is normally distributed. (a) Identify the claim and state H0 and Ha. What is: H0 and Ha? The claim is the hypothesis. (b) Use technology to find the critical value(s) and identify the rejection region(s). The critical value(s) is/are t0= (Use a comma to separate answers as needed. Round to two decimal places as needed.)arrow_forwardBlood pressure in women: The three quartiles for systolic blood pressure in a sample of 1213 women between the ages of 20 Delivery and 29 were Q,- 103, Q, = 105, and Q = 118. Part: 0/3 Part 1 of 3 Find the IQR. IQR = de home pg up pg dn ort sc delete end + & num lock backspace %23 $ 6. 8. 6. フ 9arrow_forwardThe table below shows the estimated vaccination coverage of adolescents aged 13-17 years, as reported in national surveys in 2020 and 2021. Vaccine Percent vaccinated (95% CI) Tdap (tetanus, diphtheria, and acellular pertussis vaccine) 2020: 90.1 (89.2–90.9) 2021: 89.6 (88.6–90.5) MMR (measles, mumps, and rubella vaccine) 2020: 92.4 (91.6–93.2) 2021: 92.2 (91.2–93.2) HPV (human papillomavirus vaccine) 2020: 58.6 (57.3–60.0) 2021: 61.7 (60.2–63.2) Answer these: a. For which vaccine(s) was there a statistically significant change in coverage from 2020 to 2021? For each, note whether it was a statistically significant increase or decrease? b. For which vaccine(s) was there no significant change in coverage from 2020 to 2021?arrow_forward
- Every year, the students at a school are given a musical aptitude test that rates them from 0 (no musical aptitude) to 5 (high musical aptitude). This year's results were: "Aptitude Score" "Frequency" If 0 1 2 3 4 5 sum 3 6 4 3 2 4 22 0 0 6 The mode aptitude score: 2,5 there is no mode.) 8 8 20 51 ✓o The mean aptitude score: Σ(xf) Σ(5) Please find the median aptitude score by a TI-84: 2.5 2.32 (Round to 2 decimal place.) X x (Please separate your answers by, in bimodal situation. Enter DNE ifarrow_forwardData for question on screenshot. For each of the surveys, include the Summary Statistics and your Confidence Level/Alpha. At least 90% Confidence is recommended for all 3. Television Survey: In a recent survey, it was stated that Americans watch television on average four hours per day. Assume that σ = 2. Using your class (or any 20 – 30 people) as the sample, conduct a hypothesis test to determine if the average for students at your school is lower. Do not make up your data. Write your answers in the tables below. Sample Mean Sample Standard Deviation Confidence Level What is your null hypothesis? What is your alternative hypothesis, ? In words, define the random variable. Hint: ___ = ____ The distribution to use for the test is… Determine the test statistic using your data.arrow_forwardB. What is the best predicted temperature for a time when a bug is chirping at the rate of 3000 chirps per minute? The best predicted temperature when a bug is chirping at 3000 chirps per minute is____°F. C. What is wrong with this predicted value? The first variable should have been the dependent variable. It is unrealistically high. The value 3000 is far outside of the range of observed values. It is only an approximation. An unrounded value would be considered accurate. Nothing is wrong with this value. It can be treated as an accurate prediction.arrow_forward
- 3.6 Triathlon times, Part II: The distribution for triathlon time varies depending on the population you are describing. The distribution for men ages 30 - 34 is N(µ-4323, o=562). The distribution for women ages 25 - 29 is N(μ-5227, o=828). Note, these distributions list the triathlon times in seconds. Use this information to compute each of the following. Report your answer to 2 decimal places. a) The cutoff time for the fastest 5% of athletes in the men's group, i.e. those who took the shortest 5% of time to finish. b) The cutoff time for the slowest 10% of athletes in the women's group.arrow_forwardEXER 6.3 Find the covariance and the correlation coefficient between X and Y, if X and Y are jointly discrete random variables, with joint PMF given by: SHOW SOLUTIONS X\Y 0 1 6 0 28 6 1 28 2 0 333333 28 28 28 2120 28 0arrow_forward5.3 2.4 3.5 5.2 (Reference: Crime in the United States, Federal Bureau of Investigation.) Assume that the crime rate distribution is approximately normal in both regions. i, Use a calculator to verify that x 3.51, s, = 0.81, x, = 3.87, and 0.94. i/ Do the data indicate that the violent crime rate in the Rocky Mountain region is higher than that in New England? Use a = 0.01. %3D Medical: Hay Fever A random sample of n, = 16 communities in western Kansas gave the following information for people under 25 years of age. x,: Rate of hay fever per 1000 population for people under 25 120 128 92 123 112 93 86 06 125 95 125 122 88 L6 Arandom sample of n, = 14 regions in western Kansas gave the following information for people over 50 years old. x,: Rate of hay fever per 1000 population for people over 50 95 110 97 112 88 85 110 115 114 68 96 (Reference: National Center for Health Statistics.) i. Use a calculator to verify that x 109.50, s, - 15.41, x2 - 99.36, and sh 11.57. ii. Assume that the…arrow_forward
 Glencoe Algebra 1, Student Edition, 9780079039897...AlgebraISBN:9780079039897Author:CarterPublisher:McGraw Hill