
Concept explainers
Videos
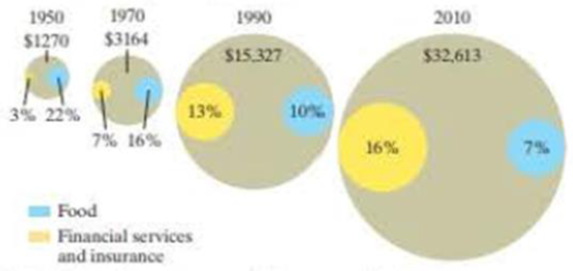
Personal Consumption Expenditures. The following graph shows the amounts of personal consumption expenditures, in dollars per person per year, in the United States, for four years. The graph also shows the amounts spent on food and on financial services and insurance for those years, labeled as percents of the personal consumption expenditures. Use the graph for Exercises 31-38.
Personal Consumption Expenditures
DATA: TIME, October 10, 2011, p.32; Infoplease.com; U.S. Census Bureau
31. How much were personal consumption expenditures per person in 1950?
Want to see the full answer?
Check out a sample textbook solution
Chapter 7 Solutions
ARITHMETIC MATH-W/ACCESS >CUSTOM<
Additional Math Textbook Solutions
The Heart of Mathematics: An Invitation to Effective Thinking
Discrete Mathematics and Its Applications ( 8th International Edition ) ISBN:9781260091991
Mathematics for the Trades: A Guided Approach (11th Edition) (What's New in Trade Math)
Algebra and Trigonometry: Graphs and Models (6th Edition)
Fundamentals of Differential Equations and Boundary Value Problems
Using & Understanding Mathematics: A Quantitative Reasoning Approach (7th Edition)


- If you graph a revenue and cost function, explain how to determine in what regions there is profit.arrow_forwardRefer to the graph below and answer What percent of the land is not included in North America?arrow_forwardThe higher education department of Holmes Institute recorded data on the number of students enrolled in the different study majors for the years 2018 and 2019. The data are stored in file STUDYMAJOR.xls. a) Use an appropriate graphical technique or chart to compare the number of enrolment in 2018 and 2019 of the different study major. Display the chart. b) Use an appropriate graphical technique or chart to display the percentage value of the number of enrolment of the different study major in 2018 and 2019. Display the chart.arrow_forward
- I am not able to see the percent tablearrow_forwardOver the past ten years, a small business owner has made at most $8,000 in profits each week.Which graph represents the business owner's possible profits each week?arrow_forwardIn 2015, there was 146,571 deaths from unintentional injury in the United States. Among these were 47,478 deaths from poisoning, 37,757 from motor vehicle accidents, 33,381 from falls, 6,914 from suffocation, and 3,602 from drowning. A) Find the percentage of accidental deaths from each of these causes, rounded to the nearest percent. What percentage of accidental deaths were due to other causes? B) Make a well-labeled graph of the distribution of causes of accidental deaths.arrow_forward
- discuss the trend analysis of the oil palm pricingarrow_forwardSalary after College. In 2010, MonsterCollege surveyed 1250 U.S.college students expecting to graduate in the next several years. Respondents were asked the following question: What do you think your starting salary will be at your first job after college? The line graph shows the percentage of college students who anticipated various starting salaries. Then Solve; What starting salaries were anticipated by more than 20% of college students?arrow_forward
 Mathematics For Machine TechnologyAdvanced MathISBN:9781337798310Author:Peterson, John.Publisher:Cengage Learning,
 Glencoe Algebra 1, Student Edition, 9780079039897...AlgebraISBN:9780079039897Author:CarterPublisher:McGraw Hill
 Holt Mcdougal Larson Pre-algebra: Student Edition...AlgebraISBN:9780547587776Author:HOLT MCDOUGALPublisher:HOLT MCDOUGAL