
Concept explainers
Videos
a.
To find:The
a.
Explanation of Solution
Given information:
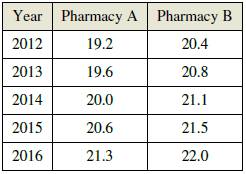
The numbers of prescriptions P (in thousands) filled at two pharmacies from 2012 through 2016 are shown in the table.
Calculations:
Let
Graph:
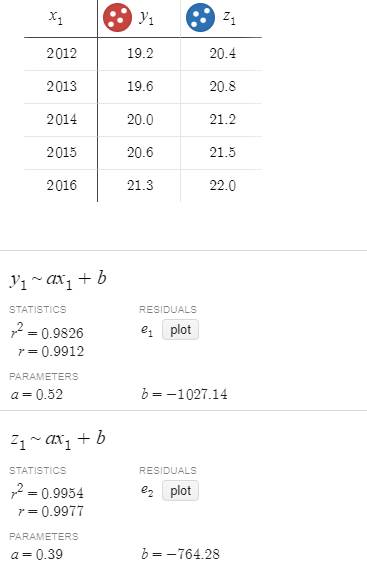
Using Desmos graphing utility, we obtain the following results:
Conclusion:
The linear model that represents the data for pharmacy A is
b.
To find: The time when the number of prescriptions filled at pharmacy A exceeds the number of prescriptions filled at pharmacy B.
b.
Answer to Problem 53E
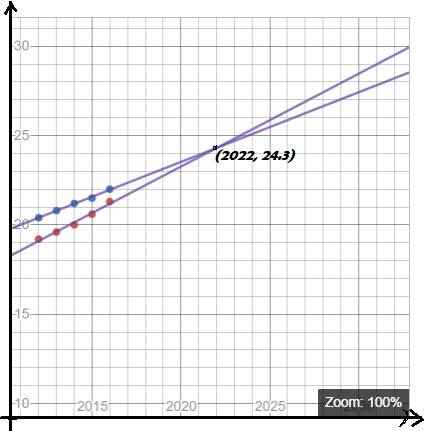
The number of prescriptions filled at pharmacy A exceeds the number of prescriptions filled at pharmacy B after the year 2022.
Explanation of Solution
Given information:
Use the linear models and the scatter plot that were found in previous part.
Graph:
Using Desmos graphing utility,

Interpretation:
From the graph, it is clear that the lines are intersected at the point
Chapter 7 Solutions
EBK PRECALCULUS W/LIMITS


 Calculus: Early TranscendentalsCalculusISBN:9781285741550Author:James StewartPublisher:Cengage Learning
 Thomas' Calculus (14th Edition)CalculusISBN:9780134438986Author:Joel R. Hass, Christopher E. Heil, Maurice D. WeirPublisher:PEARSON
 Calculus: Early Transcendentals (3rd Edition)CalculusISBN:9780134763644Author:William L. Briggs, Lyle Cochran, Bernard Gillett, Eric SchulzPublisher:PEARSON
 Calculus: Early TranscendentalsCalculusISBN:9781319050740Author:Jon Rogawski, Colin Adams, Robert FranzosaPublisher:W. H. Freeman
 Calculus: Early Transcendental FunctionsCalculusISBN:9781337552516Author:Ron Larson, Bruce H. EdwardsPublisher:Cengage Learning