
Concept explainers
Videos
a.
Construct a 95% confidence interval for the proportion of tenth-graders who plan to attend college using Wilson’s method.
a.
Answer to Problem 41E
The 95% confidence interval for the proportion of tenth-graders who plan to attend college using Wilson’s method is
Explanation of Solution
Calculation:
The given information is that,in a certain college 9 said that they planned to go to college after graduatingwhen 15 tenth-graders were asked.
Wilson’s interval:
For constructing a confidence interval the small-sample method is a simple approximation of very complicated interval that is, Wilson’s interval. Consider
Wilson’s confidence interval for p is given by,
Point estimate:
The point estimate
Substitute x as 9 and 15 as n in the formula,
Thus, the point estimate
From the bottom row of Table A.3: Critical Values for the Student’s t Distribution, the critical value
Now, substitute
Thus, the 95% confidence interval for the proportion of tenth-graders who plan to attend college using Wilson’s method is
b.
Construct a 95% confidence interval for the proportion of tenth-graders who plan to attend college using small-sample method.
b.
Answer to Problem 41E
The 95% confidence interval for the proportion of tenth-graders who plan to attend college using small-sample method is
Explanation of Solution
Calculation:
Constructing confidence intervals for a proportion with small samples:
If x represents the number of individuals in a sample of size n that has certain characteristic and p is the population proportion, then
The adjusted sample proportion is,
The confidence interval for p is,
Substitute x as 9 and n as 15 in the formula of adjusted sample proportion,
From the bottom row of Table A.3: Critical Values for the Student’s t Distribution, the critical value
Now, substitute
Thus, the 95% confidence interval for the proportion of tenth-graders who plan to attend college using small-sample method is
c.
Construct a 95% confidence interval for the proportion of tenth-graders who plan to attend college using traditional method.
c.
Answer to Problem 41E
The 95% confidence interval for the proportion of tenth-graders who plan to attend college using traditional method is
Explanation of Solution
Calculation:
Confidence interval:
Software procedure:
Step-by-step software procedure to obtain the confidence interval using MINITAB software is as follows,
- Choose Stat > Basic Statistics > 1-Proportion.
- Choose Summarized data.
- Enter Number of
events as 9 and Number of trials as 15. - Choose Options.
- In Confidence level, enter 95.
- In Alternative, select not equal.
- Click OK in all the dialogue boxes.
Output using MINITAB software is as follows
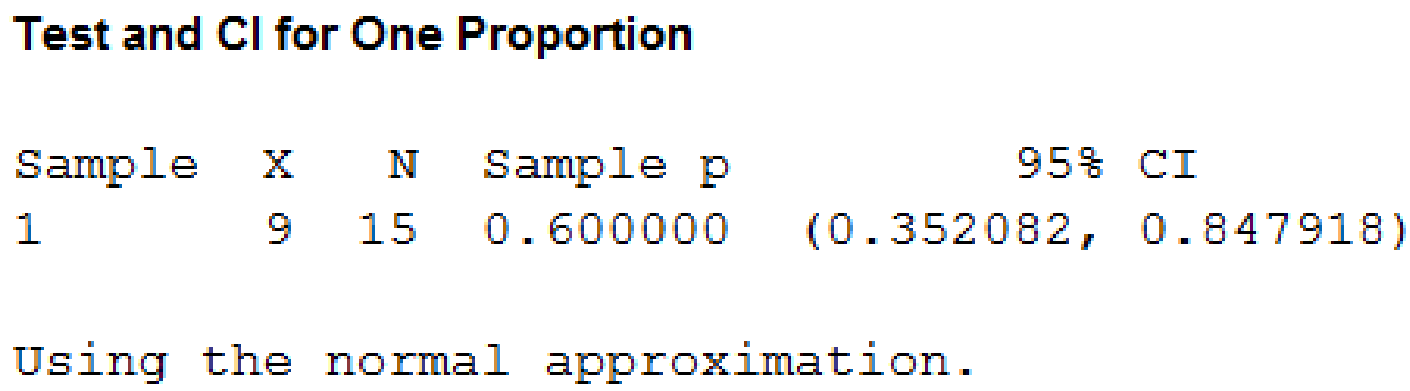
Thus, the 95% confidence interval for the proportion of tenth-graders who plan to attend college using traditional method is
Want to see more full solutions like this?
Chapter 7 Solutions
Essential Statistics


 MATLAB: An Introduction with ApplicationsStatisticsISBN:9781119256830Author:Amos GilatPublisher:John Wiley & Sons Inc
 Probability and Statistics for Engineering and th...StatisticsISBN:9781305251809Author:Jay L. DevorePublisher:Cengage Learning
 Statistics for The Behavioral Sciences (MindTap C...StatisticsISBN:9781305504912Author:Frederick J Gravetter, Larry B. WallnauPublisher:Cengage Learning
 Elementary Statistics: Picturing the World (7th E...StatisticsISBN:9780134683416Author:Ron Larson, Betsy FarberPublisher:PEARSON
 The Basic Practice of StatisticsStatisticsISBN:9781319042578Author:David S. Moore, William I. Notz, Michael A. FlignerPublisher:W. H. Freeman
 Introduction to the Practice of StatisticsStatisticsISBN:9781319013387Author:David S. Moore, George P. McCabe, Bruce A. CraigPublisher:W. H. Freeman