Mathematical Statistics with Applications
7th Edition
ISBN: 9780495110811
Author: Dennis Wackerly, William Mendenhall, Richard L. Scheaffer
Publisher: Cengage Learning
bartleby

Concept explainers

bartleby

Videos

Question
Book Icon
Chapter 7.5, Problem 67E

a.

To determine

Find the exact and approximate values of P(Yμ+3) for n=5,10,15and20.

a.

Expert Solution
Check Mark

Answer to Problem 67E

The exact and approximate values of P(Yμ+3) for n=5 are 0.9997 and 0.9532, respectively.

The exact and approximate values of P(Yμ+3) for n=10 are 0.9936 and 0.9731, respectively.

The exact and approximate values of P(Yμ+3) for n=15 are 0.9819 and 0.9761, respectively.

The exact and approximate values of P(Yμ+3) for n=20 are 0.9679 and 0.9689, respectively.

Explanation of Solution

From the given information, Y follows binomial distribution and p=0.20.

For n=5

P(Yμ+3)=P(Ynp+3)=P(Y5(0.20)+3)=P(Y4)

Step-by-step procedure to obtain the probability using APPLET:

  • Choose Normal approximation to binomial distribution under Applets.
  • Set the n value as 5 and p value as 0.20.
  • Select the bars 0 and 4.

Output using APPLET is given below:

Mathematical Statistics with Applications, Chapter 7.5, Problem 67E , additional homework tip  1

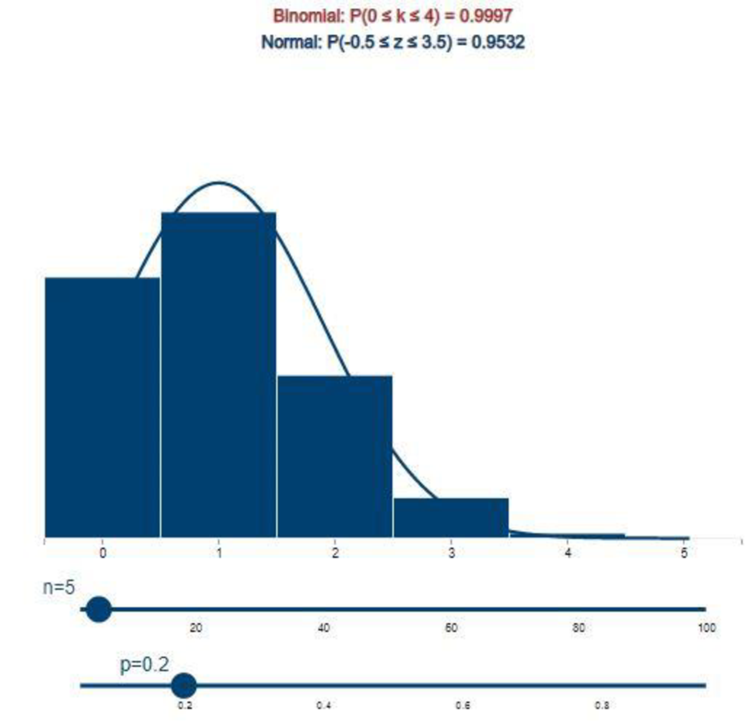
From the above output, it can be observed that exact and approximate values are 0.9997 and 0.9532, respectively.

Thus, the exact and approximate values of P(Yμ+3) for n=5 are 0.9997 and 0.9532, respectively.

For n=10

P(Yμ+3)=P(Ynp+3)=P(Y10(0.20)+3)=P(Y5)

Step-by-step procedure to obtain the probability using APPLET:

  • Choose Normal approximation to binomial distribution under Applets.
  • Set the n value as 10 and p value as 0.20.
  • Select the bars 0 and 5.

Output using APPLET is given below:

Mathematical Statistics with Applications, Chapter 7.5, Problem 67E , additional homework tip  2

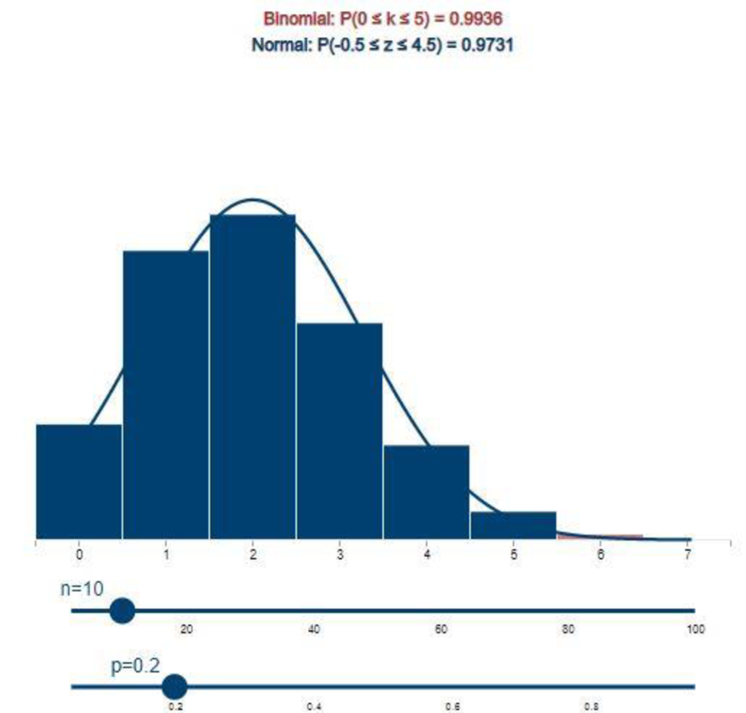
From the above output, it can be observed that exact and approximate values are 0.9936 and 0.9731, respectively.

Thus, the exact and approximate values of P(Yμ+3) for n=10 are 0.9936 and 0.9731, respectively.

For n=15

P(Yμ+3)=P(Ynp+3)=P(Y15(0.20)+3)=P(Y6)

Step-by-step procedure to obtain the probability using APPLET:

  • Choose Normal approximation to binomial distribution under Applets.
  • Set the n value as 15 and p value as 0.20.
  • Select the bars 0 and 6.

Output using APPLET is given below:

Mathematical Statistics with Applications, Chapter 7.5, Problem 67E , additional homework tip  3

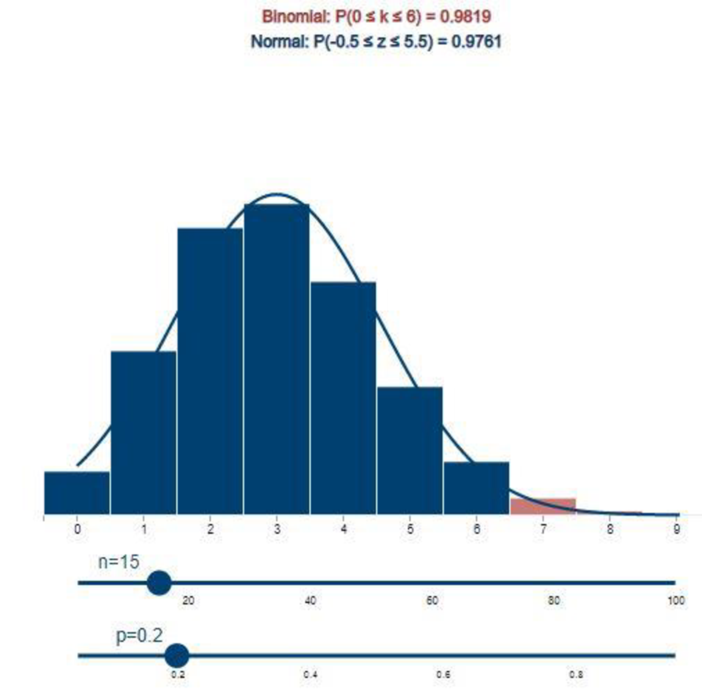
From the above output, it can be observed that exact and approximate values are 0.9819 and 0.9761, respectively.

Thus, the exact and approximate values of P(Yμ+3) for n=15 are 0.9819 and 0.9761, respectivley.

For n=20

P(Yμ+3)=P(Ynp+3)=P(Y20(0.20)+3)=P(Y7)

Step-by-step procedure to obtain the probability using APPLET:

  • Choose Normal approximation to binomial distribution under Applets.
  • Set the n value as 20 and p value as 0.20.
  • Select the bars 0 and 7.

Output using APPLET is given below:

Mathematical Statistics with Applications, Chapter 7.5, Problem 67E , additional homework tip  4

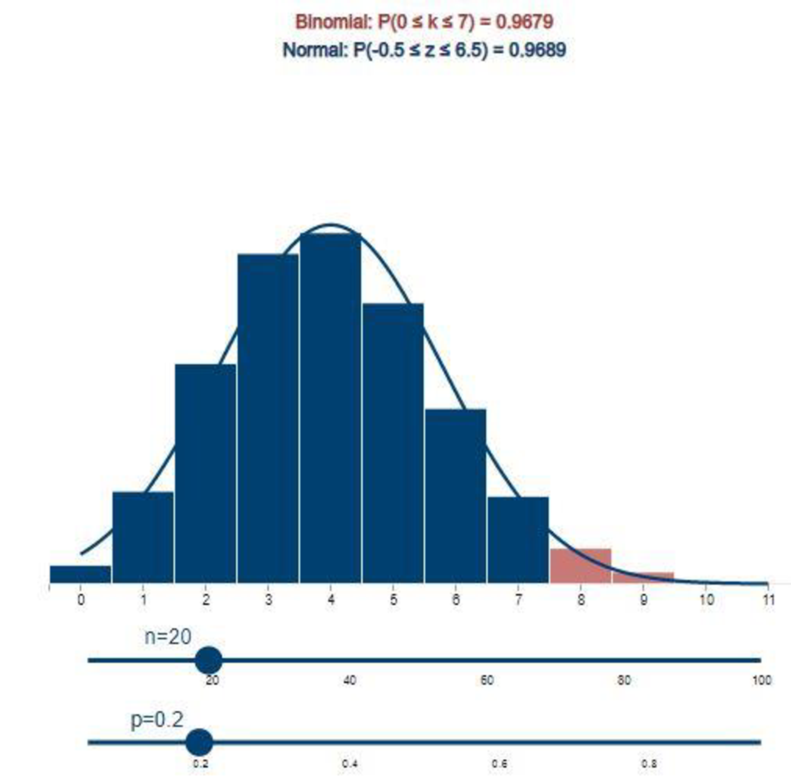
From the above output, it can be observed that exact and approximate values are 0.9679 and 0.9689, respectively.

Thus, the exact and approximate values of P(Yμ+3) for n=20 are 0.9679 and 0.9689, respectively.

b.

To determine

Give the observation about the shapes of the binomial histograms as the sample size increased by referring part (a).

Give the observation about the differences between the exact and approximate values of P(Yμ+3) as the sample size increased by referring part (a).

b.

Expert Solution
Check Mark

Answer to Problem 67E

The observation is that the shapes of the binomial histograms tend to bell shaped by increasing the sample size.

The difference between the exact and approximate values of P(Yμ+3) decreases as the sample size increases.

Explanation of Solution

From the histograms in part a, it can be observed that as the sample size increases the binomial histograms become bell shaped.

Thus, the observation is that the shapes of the binomial histograms tend to bell shaped by increasing the sample size.

From the part a, it can be observed that

The exact and approximate values of P(Yμ+3) for n=5 are 0.9997 and 0.9532, respectively. The difference is 0.99970.9532=0.0465.

The exact and approximate values of P(Yμ+3) for n=10 are 0.9936 and 0.9731, repectively. The difference is 0.99360.9731=0.0205.

The exact and approximate values of P(Yμ+3) for n=15 are 0.9819 and 0.9761, respectively. The difference is 0.98190.9761=0.0058.

The exact and approximate values of P(Yμ+3) for n=20 are 0.9679 and 0.9689, respectively. The difference is 0.96790.9689=0.001.

From the above results it can be observed that as the sample size increases the difference between the exact and approximate values of P(Yμ+3) decreases.

Thus, the difference between the exact and approximate values of P(Yμ+3) decreases as the sample size increases.

c.

To determine

Find the sample size n for the approximation to be adequate.

Check whether this is consistent with that observed in parts (a) and (b).

c.

Expert Solution
Check Mark

Answer to Problem 67E

The sample size n for the approximation to be adequate is 36.

The sample size is consistent with that observed in parts (a) and (b).

Explanation of Solution

It is known that, the normal approximate to the binomial approximation is adequate if

n>9(largerofpandqsmallerofpandq)

From the given information, p=0.2. Then, q=1p=10.2=0.8.

Then,

n>9(largerof0.2and0.8smallerof0.2and0.8)n>9(0.80.2)n>9(4)n>36

Thus, the sample size n for the approximation to be adequate is 36.

From the parts a and b it can be observed that as the sample size increases the exact and approximate values of P(Yμ+3) are nearly equal. Here, the sample size is large.

Thus, the sample size is consistent with that observed in parts (a) and (b).

Want to see more full solutions like this?

Subscribe now to access step-by-step solutions to millions of textbook problems written by subject matter experts!

Chapter 7 Solutions

Mathematical Statistics with Applications

Ch. 7.2 - Ammeters produced by a manufacturer are marketed...Ch. 7.2 - a If U has a 2 distribution with v df, find E(U)...Ch. 7.2 - Refer to Exercise 7.13. Suppose that n = 20...Ch. 7.2 - Prob. 22ECh. 7.2 - Applet Exercise a Use the applet Chi-Square...Ch. 7.2 - Applet Exercise Refer to Example 7.6. Suppose that...Ch. 7.2 - Applet Exercise Suppose that T is a t-distributed...Ch. 7.2 - Refer to Exercise 7.11. Suppose that in the forest...Ch. 7.2 - Applet Exercise Refer to Example 7.7. If we take...Ch. 7.2 - Applet Exercise Suppose that Y has an F...Ch. 7.2 - If Y is a random variable that has an F...Ch. 7.2 - Suppose that Z has a standard normal distribution...Ch. 7.2 - a Use Table 7, Appendix 3, to find F.01 for...Ch. 7.2 - Applet Exercise a Find t.05 for a t-distributed...Ch. 7.2 - Prob. 33ECh. 7.2 - Suppose that W1 and W2 are independent...Ch. 7.2 - Prob. 35ECh. 7.2 - Let S12 denote the sample variance for a random...Ch. 7.2 - Let Y1, Y2,,Y5 be a random sample of size 5 from a...Ch. 7.2 - Suppose that Y1, Y2,,Y5, Y6, Y,W, and U are as...Ch. 7.2 - Prob. 39ECh. 7.3 - The fracture strength of tempered glass averages...Ch. 7.3 - An anthropologist wishes to estimate the average...Ch. 7.3 - Suppose that the anthropologist of Exercise 7.43...Ch. 7.3 - Workers employed in a large service industry have...Ch. 7.3 - The acidity of soils is measured by a quantity...Ch. 7.3 - Prob. 47ECh. 7.3 - Prob. 48ECh. 7.3 - The length of time required for the periodic...Ch. 7.3 - Shear strength measurements for spot welds have...Ch. 7.3 - Refer to Exercise 7.50. If the standard deviation...Ch. 7.3 - Resistors to be used in a circuit have average...Ch. 7.3 - One-hour carbon monoxide concentrations in air...Ch. 7.3 - Unaltered bitumens, as commonly found in leadzinc...Ch. 7.3 - The downtime per day for a computing facility has...Ch. 7.3 - Prob. 56ECh. 7.3 - Twenty-five heat lamps are connected in a...Ch. 7.3 - Prob. 58ECh. 7.3 - Prob. 59ECh. 7.3 - Prob. 60ECh. 7.3 - Refer to Exercise 7.60. Suppose that n1 = n2 = n,...Ch. 7.3 - Prob. 62ECh. 7.3 - Refer to Exercise 7.62. Find the number of...Ch. 7.5 - Applet Exercise Suppose that Y has a binomial...Ch. 7.5 - Prob. 66ECh. 7.5 - Prob. 67ECh. 7.5 - Prob. 70ECh. 7.5 - Prob. 71ECh. 7.5 - A machine is shut down for repairs if a random...Ch. 7.5 - An airline finds that 5% of the persons who make...Ch. 7.5 - According to a survey conducted by the American...Ch. 7.5 - A pollster believes that 20% of the voters in a...Ch. 7.5 - a Show that the variance of Y/n, where Y has a...Ch. 7.5 - The manager of a supermarket wants to obtain...Ch. 7.5 - If the supermarket manager (Exercise 7.77) samples...Ch. 7.5 - Suppose that a random sample of 25 items is...Ch. 7.5 - Prob. 80ECh. 7.5 - Prob. 81ECh. 7.5 - Prob. 82ECh. 7.5 - Prob. 84ECh. 7.5 - Prob. 85ECh. 7.5 - Prob. 86ECh. 7.5 - Prob. 87ECh. 7 - The efficiency (in lumens per watt) of light bulbs...Ch. 7 - Refer to Exercise 7.88. What should be the mean...Ch. 7 - Prob. 90SECh. 7 - A retail dealer sells three brands of automobiles....Ch. 7 - From each of two normal populations with identical...Ch. 7 - Prob. 93SECh. 7 - Prob. 94SECh. 7 - The coefficient of variation (CV) for a sample of...Ch. 7 - Prob. 96SECh. 7 - Prob. 97SECh. 7 - Prob. 100SECh. 7 - Prob. 101SECh. 7 - Prob. 102SECh. 7 - Prob. 103SECh. 7 - Prob. 104SECh. 7 - If the probability that a person will suffer an...
Knowledge Booster
Background pattern image
Statistics
Learn more about
Need a deep-dive on the concept behind this application? Look no further. Learn more about this topic, statistics and related others by exploring similar questions and additional content below.
Recommended textbooks for you
Text book image
MATLAB: An Introduction with Applications
Statistics
ISBN:9781119256830
Author:Amos Gilat
Publisher:John Wiley & Sons Inc
Text book image
Probability and Statistics for Engineering and th...
Statistics
ISBN:9781305251809
Author:Jay L. Devore
Publisher:Cengage Learning
Text book image
Statistics for The Behavioral Sciences (MindTap C...
Statistics
ISBN:9781305504912
Author:Frederick J Gravetter, Larry B. Wallnau
Publisher:Cengage Learning
Text book image
Elementary Statistics: Picturing the World (7th E...
Statistics
ISBN:9780134683416
Author:Ron Larson, Betsy Farber
Publisher:PEARSON
Text book image
The Basic Practice of Statistics
Statistics
ISBN:9781319042578
Author:David S. Moore, William I. Notz, Michael A. Fligner
Publisher:W. H. Freeman
Text book image
Introduction to the Practice of Statistics
Statistics
ISBN:9781319013387
Author:David S. Moore, George P. McCabe, Bruce A. Craig
Publisher:W. H. Freeman
Statistics 4.1 Point Estimators; Author: Dr. Jack L. Jackson II;https://www.youtube.com/watch?v=2MrI0J8XCEE;License: Standard YouTube License, CC-BY
Statistics 101: Point Estimators; Author: Brandon Foltz;https://www.youtube.com/watch?v=4v41z3HwLaM;License: Standard YouTube License, CC-BY
Central limit theorem; Author: 365 Data Science;https://www.youtube.com/watch?v=b5xQmk9veZ4;License: Standard YouTube License, CC-BY
Point Estimate Definition & Example; Author: Prof. Essa;https://www.youtube.com/watch?v=OTVwtvQmSn0;License: Standard Youtube License
Point Estimation; Author: Vamsidhar Ambatipudi;https://www.youtube.com/watch?v=flqhlM2bZWc;License: Standard Youtube License