
Concept explainers
Videos
The graphing calculator screen displays an exponential function that models the U.S. population age 65 and over, y, in millions, x years after 1899. Use this information to solve Exercises 31-32.
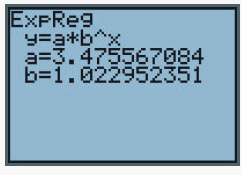
a. Explain why an exponential function was used to model the population data.
b. Use the graphing calculator screen to express the model in function notation, with numbers rounded to three decimal places.
c. According to the model in part (b), how many Americans age 65 and over were there in 2010? Use a calculator with a
key or a
d. According to the model in part (b), how many Americans age 65 and over will there be in 2020? Round to one decimal place. Does this rounded number overestimate or underestimate the 2020 population projection displayed by the bar graph? By how much?
Want to see the full answer?
Check out a sample textbook solution
Chapter 7 Solutions
Thinking Mathematically (7th Edition)


- Given a formula for an exponential function, is itpossible to determine whether the function grows ordecays exponentiallyjust by looking at the formula?Explain.arrow_forwardWhat happens to an exponential function as the values of x decreases? Will the graph ever cross the y -axis? Explain.arrow_forward
 Algebra & Trigonometry with Analytic GeometryAlgebraISBN:9781133382119Author:SwokowskiPublisher:Cengage
 Big Ideas Math A Bridge To Success Algebra 1: Stu...AlgebraISBN:9781680331141Author:HOUGHTON MIFFLIN HARCOURTPublisher:Houghton Mifflin Harcourt
 Glencoe Algebra 1, Student Edition, 9780079039897...AlgebraISBN:9780079039897Author:CarterPublisher:McGraw Hill
 College Algebra (MindTap Course List)AlgebraISBN:9781305652231Author:R. David Gustafson, Jeff HughesPublisher:Cengage Learning