
Concept explainers
Videos
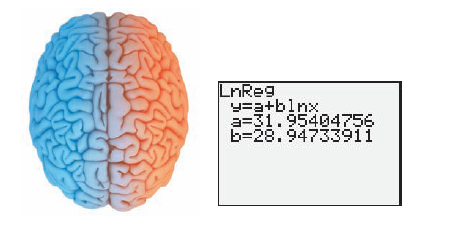
The graphing calculator screen displays the percentage of an adult size brain, y for a child at age x, where
Use this information to solve Exercises 35-36.
a. Explain why a logarithmic function was used to model the data.
b. Use the graphing calculator screen to express the model in function notation, with numbers rounded to the nearest whole number.
c. According to the model in part (b), what percentage of an adult size brain does a child have at age 10? Use a calculator with an
key and round to the nearest whole percent. Does this overestimate or underestimate the percent displayed by the table? By how much?
Want to see the full answer?
Check out a sample textbook solution
Chapter 7 Solutions
CUSTOM BLITZER THINKING MATHEMATICALLY


- The half-life of plutonium-244 is 80,000,000 years. Find function gives the amount of carbon-14 remaining as a function of time, measured in years.arrow_forwardDetermine whether Table 1 could represent a function that is linear, exponential, or neither. If it appears to beexponential find a function that passes through the points.arrow_forwardWhat happens to an exponential function as the values of x decreases? Will the graph ever cross the y -axis? Explain.arrow_forward
 Big Ideas Math A Bridge To Success Algebra 1: Stu...AlgebraISBN:9781680331141Author:HOUGHTON MIFFLIN HARCOURTPublisher:Houghton Mifflin Harcourt
 Algebra & Trigonometry with Analytic GeometryAlgebraISBN:9781133382119Author:SwokowskiPublisher:Cengage
 Algebra for College StudentsAlgebraISBN:9781285195780Author:Jerome E. Kaufmann, Karen L. SchwittersPublisher:Cengage Learning
 Glencoe Algebra 1, Student Edition, 9780079039897...AlgebraISBN:9780079039897Author:CarterPublisher:McGraw Hill