Introduction To Statistics And Data Analysis
6th Edition
ISBN: 9781337793612
Author: PECK, Roxy.
Publisher: Cengage Learning,
bartleby

Videos

Question
Book Icon
Chapter 7.7, Problem 107E

a.

To determine

Construct the histogram for body mass of the 50 difference bird species based on the class intervals.

Identify whether transformation of the data is desirable or not.

a.

Expert Solution
Check Mark

Answer to Problem 107E

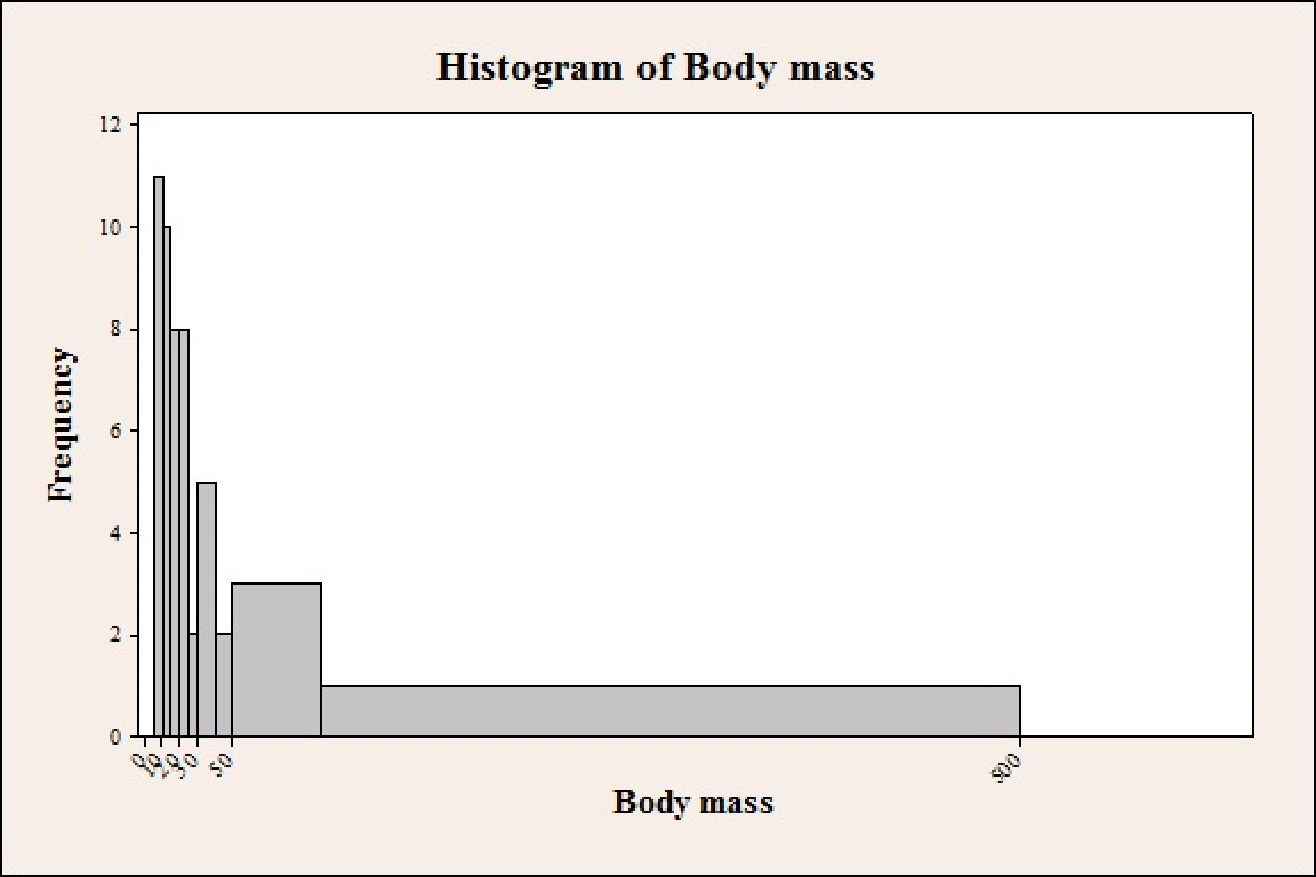
The histogram for body mass of the 50 difference bird species based on the class intervals is given below:

Introduction To Statistics And Data Analysis, Chapter 7.7, Problem 107E , additional homework tip  1

The transformation of the data is desirable.

Explanation of Solution

Calculation:

It is given that the body mass of the 50 different bird species.

Software procedure:

Step-by-step procedure to construct the histogram using the MINITAB software:

  • Choose Graph > Histogram.
  • Select Simple, and then click OK.
  • In Graph variables, enter the corresponding column of Body mass.
  • Click OK.
  • Double click on x axis and select Binning.
  • Choose Cutpoint and enter Number of intervals as 9.
  • Enter 5 10 15 20 25 30 40 50 100 500 under Midpoint/Cutpoint positions.
  • Click Ok.

From the histogram, it can be observed that most of the data values fall towards the left of the distribution extending the tail towards the right indicating that the distribution of body mass is positively skewed. Thus, for making the data symmetric a transformation is needed.

Hence, the transformation of the data is desirable.

b.

To determine

Construct the histogram by transforming the data using logarithms.

Identify whether the log transformation was successful in producing a more symmetric distribution or not.

b.

Expert Solution
Check Mark

Answer to Problem 107E

The histogram by transforming the data using logarithms is given below:

Introduction To Statistics And Data Analysis, Chapter 7.7, Problem 107E , additional homework tip  2

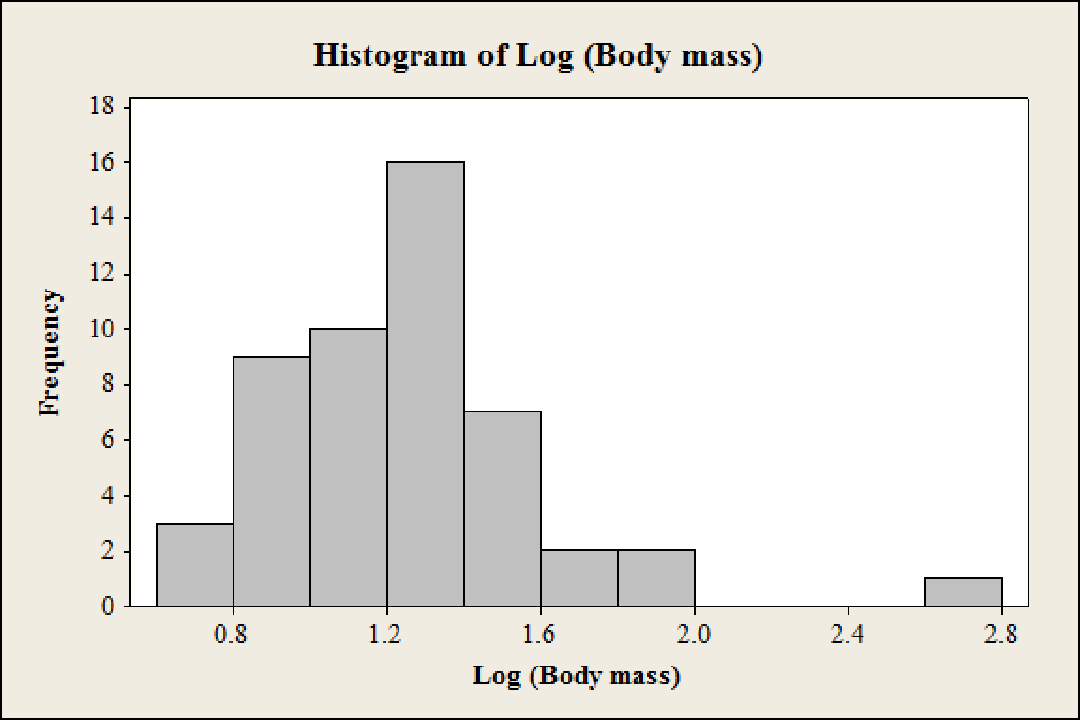
Yes, the log transformation was successful in producing a more symmetric distribution.

Explanation of Solution

Calculation:

It is given that the body mass of the 50 different bird species. The log for the data values is obtained as shown below:

Body MassLog (Body Mass)Transformed values
7.7log (7.7)0.88649
10.1log (10.1)1.00432
21.6log (21.6)1.33445
8.6log (8.6)0.93450
12log (12)1.07918
11.4log (11.4)1.05690
16.6log (16.6)1.22011
9.4log (9.4)0.97313
11.5log (11.5)1.06070
9log (9)0.95424
8.2log (8.2)0.91381
20.2log (20.2)1.30535
48.5log (48.5)1.68574
21.6log (21.6)1.33445
26.1log (26.1)1.41664
6.2log (6.2)0.79239
19.1log (19.1)1.28103
21log (21)1.32222
28.1log (28.1)1.44871
10.6log (10.6)1.02531
31.6log (31.6)1.49969
6.7log (6.7)0.82607
5log (5)0.69897
68.8log (68.8)1.83759
23.9log (23.9)1.37840
19.8log (19.8)1.29667
20.1log (20.1)1.30320
6log (6)0.77815
99.6log (99.6)1.99826
19.8log (19.8)1.29667
16.5log (16.5)1.21748
9log (9)0.95424
448log (448)2.65128
21.3log (21.3)1.32838
17.4log (17.4)1.24055
36.9log (36.9)1.56703
34log (34)1.53148
41log (41)1.61278
15.9log (15.9)1.20140
12.5log (12.5)1.09691
10.2log (10.2)1.00860
31log (31)1.49136
21.5log (21.5)1.33244
11.9log (11.9)1.07555
32.5log (32.5)1.51188
9.8log (9.8)0.99123
93.9log (93.9)0.97267
10.9log (10.9)1.03743
19.6log (19.6)1.29226
14.5log (14.5)1.16137

Software procedure:

Step-by-step procedure to obtain histogram using MINITAB:

  • Choose Graph > Histogram.
  • Choose Simple, and then click OK.
  • In Graph variables, enter the corresponding column of Logarithm of Body mass.
  • Click OK.
  • On graph right click on X axis, select edit X scale.
  • Select Binning.
  • Under Interval Type, Choose cut point.
  • Click OK.

Justification: It can be observed that the histogram of the transformed data (using logarithms) is more near to symmetrical shape when compared to the untransformed data. This shows that using the transformation of logarithms produce a more symmetrical distribution for body mass.

Hence, the log transformation was successful in producing a more symmetric distribution.

c.

To determine

Construct the histogram by transforming the data using 1original value.

Identify whether the transformation 1original value appears to resemble a normal distribution or not.

c.

Expert Solution
Check Mark

Answer to Problem 107E

The histogram by transforming the data using 1original value is given below:

Introduction To Statistics And Data Analysis, Chapter 7.7, Problem 107E , additional homework tip  3

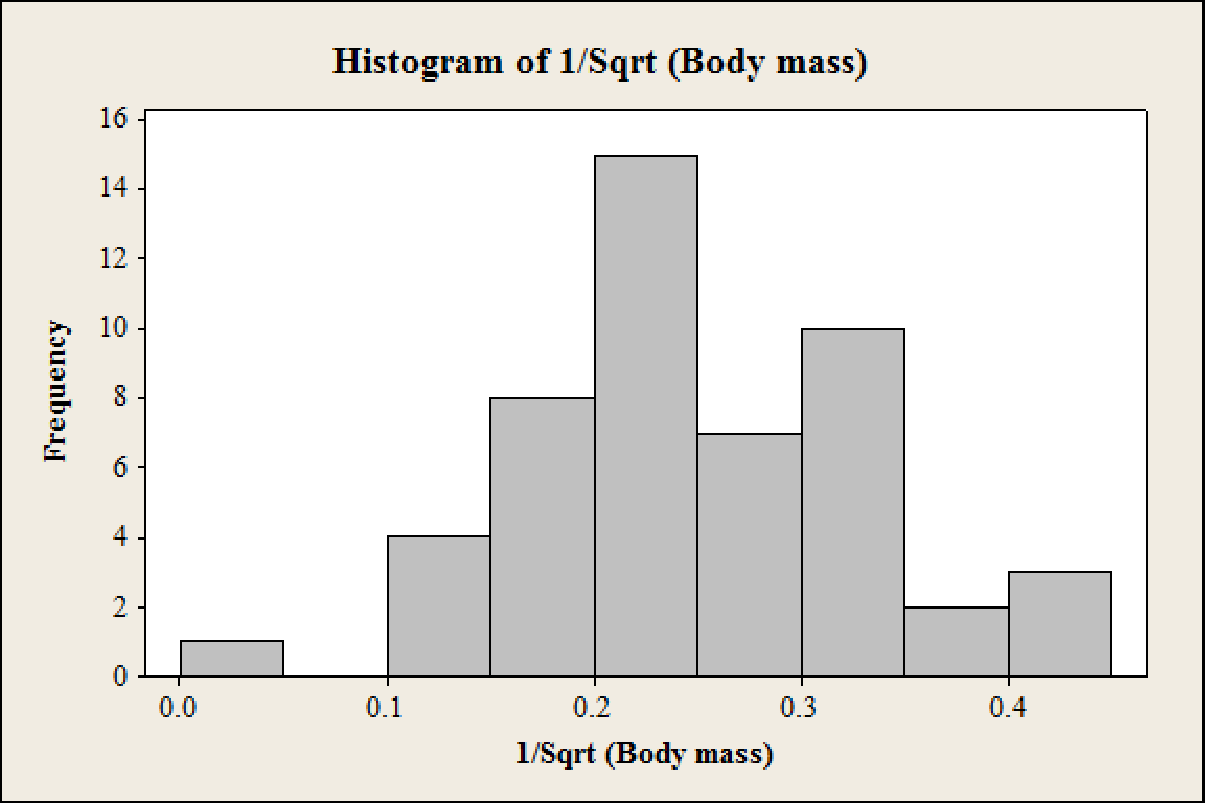
Yes, the transformation 1original value appears to resemble approximately a normal distribution.

Explanation of Solution

Calculation:

The transformation for the data values using 1original value is obtained as shown below:

Body Mass1original value of body massTransformed values
7.717.70.360375
10.1110.10.314658
21.6121.60.215166
8.618.60.340997
121120.288675
11.4111.40.296174
16.6116.60.245440
9.419.40.326164
11.5111.50.294884
9190.333333
8.218.20.349215
20.2120.20.222497
48.5148.50.143592
21.6121.60.215166
26.1126.10.195740
6.216.20.401610
19.1119.10.228814
211210.218218
28.1128.10.188646
10.6110.60.307148
31.6131.60.177892
6.716.70.386334
5150.447214
68.8168.80.120561
23.9123.90.204551
19.8119.80.224733
20.1120.10.223050
6160.408248
99.6199.60.100201
19.8119.80.224733
16.5116.50.246183
9190.333333
44814480.017546
21.3121.30.216676
17.4117.40.239732
36.9136.90.164622
341340.171499
411410.156174
15.9115.90.250785
12.5112.50.282843
10.2110.20.313112
311310.179605
21.5121.50.215666
11.9111.90.289886
32.5132.50.175412
9.819.80.319438
93.9193.90.103197
10.9110.90.302891
19.6119.60.225877
14.5114.50.262613

Software procedure:

Step-by-step procedure to obtain histogram using MINITAB:

  • Choose Graph > Histogram.
  • Choose Simple, and then click OK.
  • In Graph variables, enter the corresponding column of 1/sqrt(Body mass).
  • Click OK.
  • On graph right click on X axis, select edit X scale.
  • Select Binning.
  • Under Interval Type, Choose cut point.
  • Click OK.

Justification: It can be observed that the histogram of the transformed data (using 1Body mass) is more near to symmetrical shape when compared to the untransformed data and even the transformation using logarithms. This shows that using the transformation 1Body mass, has produced a more symmetrical distribution making it approximately normal.

Hence, the transformation 1original value appears to resemble approximately a normal distribution.

Want to see more full solutions like this?

Subscribe now to access step-by-step solutions to millions of textbook problems written by subject matter experts!

Chapter 7 Solutions

Introduction To Statistics And Data Analysis

Ch. 7.2 - Use the probability distribution given in the...Ch. 7.2 - Suppose that fund-raisers at a university call...Ch. 7.2 - Airlines sometimes overbook flights. Suppose that...Ch. 7.2 - Suppose that a computer manufacturer receives...Ch. 7.2 - Simulate the chance experiment described in the...Ch. 7.2 - Of all airline flight requests received by a...Ch. 7.2 - Suppose that 20% of all homeowners in an...Ch. 7.2 - A box contains five slips of paper, marked 1, 1,...Ch. 7.2 - Components coming off an assembly line are either...Ch. 7.2 - When applying for a building permit, a contractor...Ch. 7.2 - A library subscribes to two different weekly news...Ch. 7.3 - Let x denote the lifetime (in thousands of hours)...Ch. 7.3 - Using the density curve for fan lifetime given in...Ch. 7.3 - A particular professor never dismisses class...Ch. 7.3 - Refer to the probability distribution given in the...Ch. 7.3 - The article Probabilistic Risk Assessment of...Ch. 7.3 - Use the density curve of x = distance of actual...Ch. 7.3 - Let x denote the amount of gravel sold (in tons)...Ch. 7.3 - Use the density curve for x = amount of gravel...Ch. 7.3 - Let x be the amount of time (in minutes) that a...Ch. 7.3 - Ref erring to the previous exercise, let x and y...Ch. 7.3 - The density curve for the random variable w (the...Ch. 7.4 - Consider selecting a household in rural Thailand...Ch. 7.4 - Suppose the probability distribution of x, the...Ch. 7.4 - Consider the following probability distribution...Ch. 7.4 - Referring to the previous exercise, use the result...Ch. 7.4 - Exercise 7.8 gave the following probability...Ch. 7.4 - Prob. 38ECh. 7.4 - Prob. 39ECh. 7.4 - Refer to the information given in Exercise 7.39....Ch. 7.4 - Refer to the information given in Exercise 7.39....Ch. 7.4 - Suppose that for a particular computer...Ch. 7.4 - A local television station sells 15-second,...Ch. 7.4 - An author has written a book and submitted it to a...Ch. 7.4 - A grocery store has an express line for customers...Ch. 7.4 - An appliance dealer sells three different models...Ch. 7.4 - To assemble a piece of furniture, a wood peg must...Ch. 7.4 - A multiple-choice exam consists of 50 questions....Ch. 7.4 - Consider a game in which a red die and a blue die...Ch. 7.4 - Consider the random variables xR and xB defined in...Ch. 7.5 - CBS News reported that 4% of adult Americans have...Ch. 7.5 - Flight View surveyed 2600 North American airline...Ch. 7.5 - Refer to the previous exercise, and suppose that...Ch. 7.5 - Twenty-five percent of the customers of a grocery...Ch. 7.5 - Example 7.18 described a study in which a person...Ch. 7.5 - Information Security Buzz provides news for the...Ch. 7.5 - A breeder of show dogs is interested in the number...Ch. 7.5 - Womens Health Magazine surveyed 1187 readers to...Ch. 7.5 - Prob. 60ECh. 7.5 - Suppose that the probability is 0.1 that any given...Ch. 7.5 - Suppose that 30% of all automobiles undergoing an...Ch. 7.5 - Suppose that you will take a multiple-choice exam...Ch. 7.5 - Suppose that 20% of the 10,000 signatures on a...Ch. 7.5 - A city requires that smoke detectors be installed...Ch. 7.5 - Suppose that 90% of all registered California...Ch. 7.5 - Suppose a playlist on a music player consists of...Ch. 7.5 - Sophie is a dog that loves to play catch....Ch. 7.5 - Suppose that 5% of cereal boxes contain a prize...Ch. 7.6 - Determine the following standard normal (z) curve...Ch. 7.6 - Determine the following standard normal (z) curve...Ch. 7.6 - Determine each of the following areas under the...Ch. 7.6 - Determine each of the following areas under the...Ch. 7.6 - Let z denote a random variable that has a standard...Ch. 7.6 - Let z denote a random variable that has a standard...Ch. 7.6 - Let z denote a random variable having a normal...Ch. 7.6 - Let z denote a random variable having a normal...Ch. 7.6 - Let z denote a variable that has a standard normal...Ch. 7.6 - Determine the value z that a. Separates the...Ch. 7.6 - Determine the value of z such that a. z and z...Ch. 7.6 - Because P(z 0.44) = 0.67, 67% of all z values are...Ch. 7.6 - Consider the population of all 1-gallon cans of...Ch. 7.6 - Consider babies born in the normal range of 3743...Ch. 7.6 - Use the information on birth weights for babies...Ch. 7.6 - Emissions of nitrogen oxides, which are major...Ch. 7.6 - The paper referenced in Example 7.30 (Estimating...Ch. 7.6 - The size of the left upper chamber of the heart is...Ch. 7.6 - The paper referenced in the previous exercise also...Ch. 7.6 - The article New York Citys Graffiti-Removal...Ch. 7.6 - A machine that cuts corks for wine bottles...Ch. 7.6 - Refer to the previous exercise. Suppose that there...Ch. 7.6 - Purchases made at small corner stores were studied...Ch. 7.6 - The time that it takes a randomly selected job...Ch. 7.6 - Suppose that the distribution of typing speed in...Ch. 7.6 - Consider the typing speed distribution described...Ch. 7.6 - Consider the typing speed distribution described...Ch. 7.7 - The authors of the paper Development of...Ch. 7.7 - The paper Risk Behavior, Decision Making, and...Ch. 7.7 - Prob. 99ECh. 7.7 - Prob. 100ECh. 7.7 - Macular degeneration is the most common cause of...Ch. 7.7 - The following normal probability plot was...Ch. 7.7 - Consider the following 10 observations on the...Ch. 7.7 - Prob. 104ECh. 7.7 - Prob. 105ECh. 7.7 - Prob. 106ECh. 7.7 - Prob. 107ECh. 7.7 - The figure on the next page appeared in the paper...Ch. 7.8 - Let x denote the IQ of an individual selected at...Ch. 7.8 - Suppose that the distribution of x = the number of...Ch. 7.8 - The number of vehicles leaving a turnpike at a...Ch. 7.8 - Suppose that x has a binomial distribution with n...Ch. 7.8 - Prob. 113ECh. 7.8 - Prob. 114ECh. 7.8 - Prob. 115ECh. 7.8 - Suppose that 70% of the bicycles sold by a certain...Ch. 7.8 - Suppose that 25% of the fire alarms in a large...Ch. 7.8 - Suppose that 65% of all registered voters in a...Ch. 7.8 - Flashlight bulbs manufactured by a certain company...Ch. 7.8 - A company that manufactures mufflers for cars...Ch. 7 - Let x denote the duration of a randomly selected...Ch. 7 - A soft-drink machine dispenses only regular Coke...Ch. 7 - A business has six customer service telephone...Ch. 7 - Prob. 124CRCh. 7 - Refer 10 the probability distribution given in...Ch. 7 - A new batterys voltage may be acceptable (A) or...Ch. 7 - A pizza company advertises that it puts 0.5 pounds...Ch. 7 - Suppose that fuel efficiency for a particular...Ch. 7 - A coin is flipped 25 times. Let x be the number of...Ch. 7 - The probability distribution of x, the number of...Ch. 7 - The amount of time spent by a statistical...Ch. 7 - The lifetime of a certain brand of battery is...Ch. 7 - A machine producing vitamin E capsules operates so...Ch. 7 - The Wall Street Journal (February 15, 1972)...Ch. 7 - The longest run of Ss in the sequence SSFSSSSFFS...Ch. 7 - Four peoplea, b, c, and dare waiting to give...Ch. 7 - Kyle and Lygia are going to play a series of...Ch. 7 - Suppose that your statistics professor tells you...Ch. 7 - Suppose that the pH of soil samples taken from a...Ch. 7 - The lightbulbs used to provide exterior lighting...Ch. 7 - Suppose there are approximately 40,000 travel...Ch. 7 - Prob. 2CRECh. 7 - Prob. 3CRECh. 7 - Prob. 5CRECh. 7 - Prob. 6CRECh. 7 - Two shipping services offer overnight delivery of...Ch. 7 - Prob. 8CRECh. 7 - Prob. 9CRECh. 7 - The Cedar Rapids Gazette (November 20, 1999)...Ch. 7 - Prob. 11CRECh. 7 - The article Men, Women at Odds on Gun Control...Ch. 7 - Suppose that a new Internet company Mumble.com...Ch. 7 - Refer to the previous exercise. Suppose that...Ch. 7 - A chemical supply company currently has in stock...Ch. 7 - Prob. 16CRECh. 7 - An experiment was conducted to investigate whether...Ch. 7 - A machine that produces ball bearings has...Ch. 7 - Consider the variable x = time required for a...Ch. 7 - The accompanying data on x = student-teacher ratio...Ch. 7 - Prob. 21CRE
Knowledge Booster
Background pattern image
Statistics
Learn more about
Need a deep-dive on the concept behind this application? Look no further. Learn more about this topic, statistics and related others by exploring similar questions and additional content below.
Recommended textbooks for you
Text book image
Algebra & Trigonometry with Analytic Geometry
Algebra
ISBN:9781133382119
Author:Swokowski
Publisher:Cengage
Text book image
Holt Mcdougal Larson Pre-algebra: Student Edition...
Algebra
ISBN:9780547587776
Author:HOLT MCDOUGAL
Publisher:HOLT MCDOUGAL
What Are Research Ethics?; Author: HighSchoolScience101;https://www.youtube.com/watch?v=nX4c3V23DZI;License: Standard YouTube License, CC-BY
What is Ethics in Research - ethics in research (research ethics); Author: Chee-Onn Leong;https://www.youtube.com/watch?v=W8Vk0sXtMGU;License: Standard YouTube License, CC-BY