
Videos
The authors of the paper “Development of Nutritionally At-Risk Young Children is Predicted by Malaria, Anemia, and Stunting in Pemba, Zanzibar” (The Journal of Nutrition [2009]:763–772) studied factors that might be related to dietary deficiencies in children. Children were observed for a length of time and the time spent in various activities was recorded. One variable of interest was the length of time (in minutes) a child spent fussing.
The authors comment that the distribution of fussing times was skewed and that they used a square root transformation to create a distribution that was more approximately normal. Data consistent with summary quantities in the paper for 15 children are given in the accompanying table.
Normal scores for a samples size of 15 are also given.
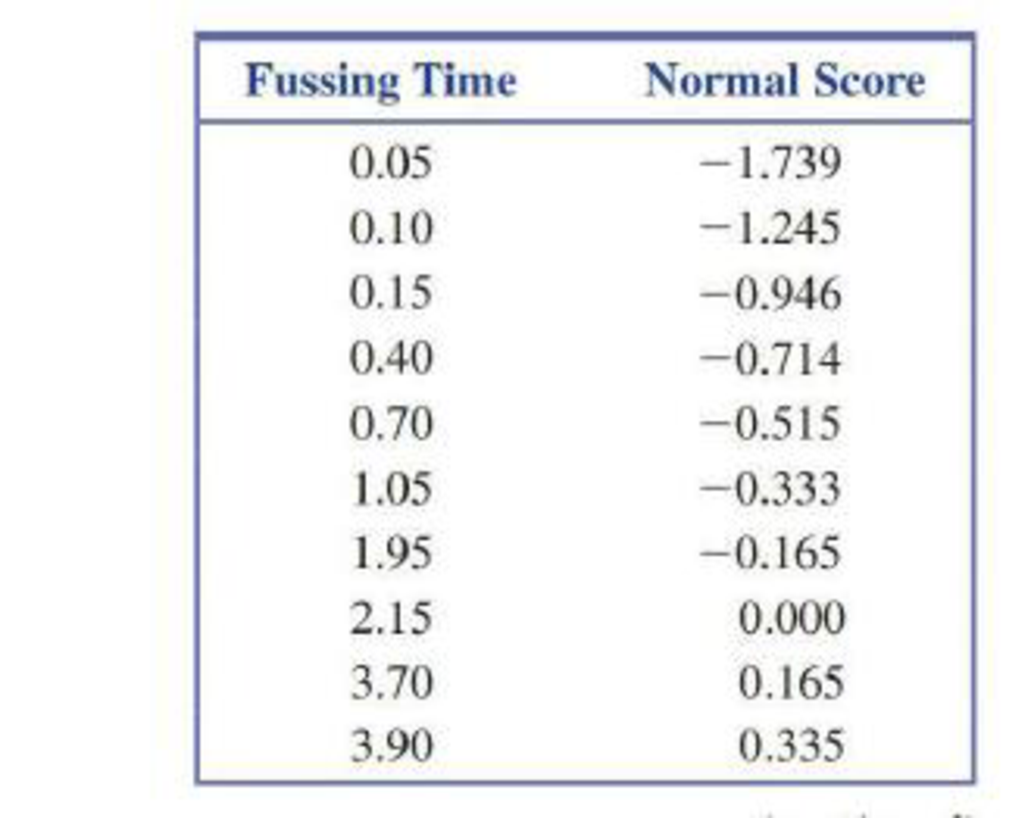
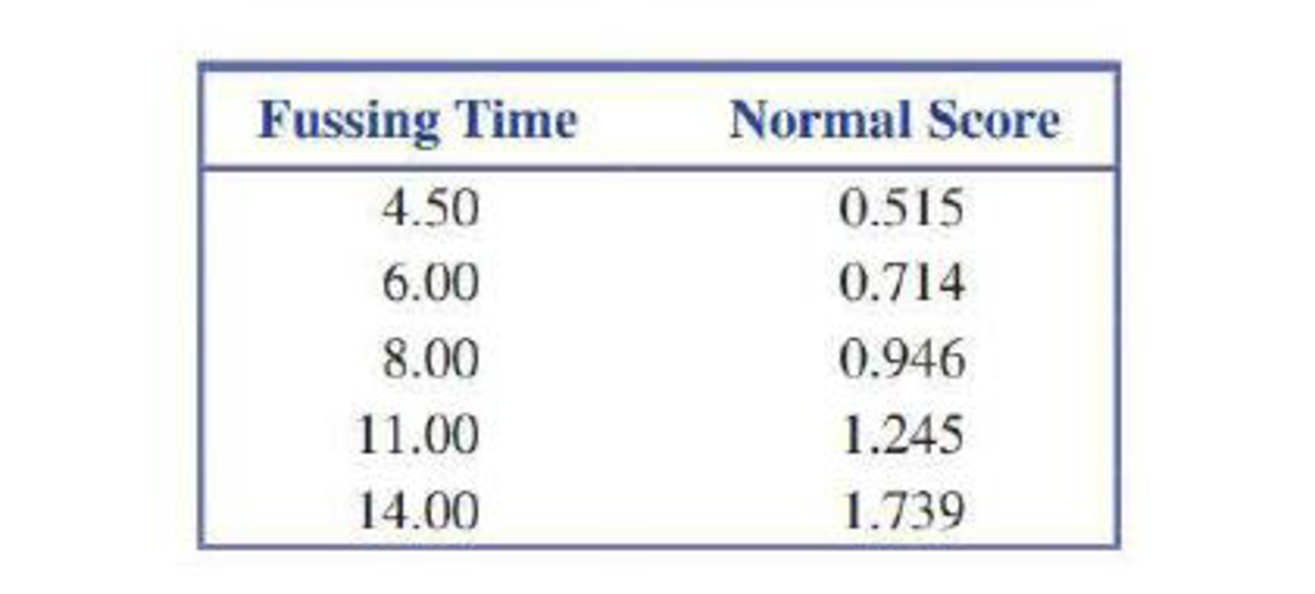
- a. Construct a normal
probability plot for the fussing time data. (Hint: See Example 7.31.) - b. Does the plot from Part (a) look linear? Do you agree with the authors of the paper that the fussing time distribution is not normal?
- c. Transform the data by taking the square root of each data value. Construct a normal probability plot for the square root transformed data.
- d. How do the normal probability plots from Parts (a) and (c) compare?
Want to see the full answer?
Check out a sample textbook solution
Chapter 7 Solutions
Introduction To Statistics And Data Analysis


- A study was performed on 200 elementary school students to investigate whether regular Vitamin A supplementation was effective in preventing colds during the month of March. 100 were randomized to receive daily Vitamin A supplements during the month of March, and 100 students were randomized to a placebo group (and did not receive Vitamin A) during the same month. The number of students getting at least one cold in March was computed in the two groups, and the results are given in the following 2 X 2 table. Using a 5% level of significance determine whether there is an association between Vitamin A supplementation and prevention of Common Cold ColdNo Cold Vitamin A1585100 Placebo2575100 40160200arrow_forwardA consumer advocacy group wanted to study whether different airline carriers differed in terms of their delayed flights. In particular, the researchers were interested in the relationship between p1, the proportion of Alpha Airlines flights that were delayed at least 15 minutes, and p2, the proportion of Beta Airlines flights that were delayed at least 15 minutes. A random sample of 1,000 Alpha flights and a separate random sample of 1,000 Beta flights found that 67 of the Alpha fights and 160 of the Beta flights were delayed at least 15 minutes. The conditions for inference were checked and verified. Does this set of samples provide strong evidence that Alpha Airlines has a smaller proportion of flights that are delayed at least 15 minutes than Beta Airlines, at the α = 0.05 significance level? Find the z-table here. A. The test statistic is z = –6.56 and the P-value ≈ 0. Since the P-value ≈ 0 < 0.05, there is not sufficient evidence that Alpha Airlines has fewer delayed…arrow_forwardThe article “Effects of Diets with Whole Plant-Origin Proteins Added with Different Ratiosof Taurine:Methionine on the Growth, Macrophage Activity and Antioxidant Capacity ofRainbow Trout (Oncorhynchus mykiss) Fingerlings” (O. Hernandez, L. Hernandez, et al.,Veterinary and Animal Science, 2017:4-9) reports that a sample of 210 juvenile rainbowtrout fed a diet fortified with equal amounts of the amino acids taurine and methionine for aperiod of 70 days had a mean weight gain of 313 percent with a standard deviation of 25, while 210 fish fed with a control diet had a mean weight gain of 233 percent with a standard deviation of 19. Units are percent. Find a 99% confidence interval for the difference in weight gain on the two diets.arrow_forward
- A low-level CDC bureaucrat wants to please his boss by gathering evidence thatthe current government-mandated shutdown of society is not causing people’s mentalhealth to deteriorate, so that it can safely be continued for several years if anyexpert says it’s necessary.He polls a random sample of 1600 citizens, gathering data on such items asincome loss, weight gain, access to toilet paper, hours spent binge-watchingNetflix, and number of injuries caused by household fights, and compiles all thisinto a scientifically-weighted “misery index”.The mean misery index from the sample is 99.2; it seems reasonable to use apopulation standard deviation σ = 19.1.a) Does this information provide significant evidence (at the 5% level) that thenationwide mean misery index is less than 100? Set up appropriate null andalternative hypotheses, calculate the appropriate test statistic, find the P-value,and state your conclusion. (10)b) A CDC press release publishing the results of this study claims that…arrow_forwardA low-level CDC bureaucrat wants to please his boss by gathering evidence thatthe current government-mandated shutdown of society is not causing people’s mentalhealth to deteriorate, so that it can safely be continued for several years if anyexpert says it’s necessary.He polls a random sample of 1600 citizens, gathering data on such items asincome loss, weight gain, access to toilet paper, hours spent binge-watchingNetflix, and number of injuries caused by household fights, and compiles all thisinto a scientifically-weighted “misery index”.The mean misery index from the sample is 99.2; it seems reasonable to use apopulation standard deviation σ = 19.1.a) Does this information provide significant evidence (at the 5% level) that thenationwide mean misery index is less than 100? Set up appropriate null andalternative hypotheses, calculate the appropriate test statistic, find the P-value,and state your conclusion. b) A CDC press release publishing the results of this study claims that…arrow_forwardTo examine adolescent substance abuse, Li, Pentz, and Chou (2002) surveyed 1,807 middle school students from 57 schools. The results showed that a greater risk of adolescent substance abuse was associated with increasing numbers of parents and friends who were sub- stance abusers. However, friends’ use did not affect adolescent substance abuse when parents were nonusers. Is this an example of a research design?arrow_forward
- A suburban hotel derives its revenue from its hotel and restaurant operations. Theowners are interested in the relationship between the number of rooms occupied on anightly basis and the revenue per day in the restaurant. Below is a sample of 25 days(Monday through Thursday) from last year showing the restaurant income and numberof rooms occupied.arrow_forwardA sample of men and women who had passed their driver's test either the first time or the second time were surveyed, with the following results: Results of the driving testGender First time Second timeMen 126 211Women 135 178a) Do these data suggest that there is a relationship between gender and the passing of their driver’s test from which the present sample was drawn? Let alpha=.05arrow_forwardA psychologist at a private mental hospital was asked to determine whether there was a clear difference in the length of stay for patients with different categories of diagnosis. Looking at the last four patients in each of the three major categories, the results (in terms of weeks of stay) were as follows: Diagnosis Category Affective Disorders Cognitive Disorders Drug-Related Conditions 7 12 8 6 8 10 5 9 12 6 11 10 Using alpha = 0.05, is there a significant difference in length of stay among diagnosis categories? Show all five steps of hypothesis testing. For additional practice, compute the means and standard deviations for each group. What is the purpose of a post hoc test? What does it tell us? Explain why we do not need a post hoc test if there are only two groups in our study. Conduct Tukey's HSD post hoc test to determine where there is a difference in the three groups.arrow_forward
- A psychologist at a private mental hospital was asked to determine whether there was a clear difference in the length of stay for patients with different categories of diagnosis. Looking at the last four patients in each of the three major categories, the results (in terms of weeks of stay) were as follows: Diagnosis Category Affective Disorders Cognitive Disorders Drug-Related Conditions 7 12 8 6 8 10 5 9 12 6 11 10 Using alpha = 0.05, is there a significant difference in length of stay among diagnosis categories? Show all five steps of hypothesis testing and compute the means and standard deviations for each group.arrow_forward4) A medical researcher is interested in determining if there is a relationship between adults over 50 who exercise regularly and low, moderate, and high blood pressure. A random sample of 236 adults over 50 is selected and the results are given below. Test the claim that regular exercise and low, moderate, and high blood pressure are independent. Use alpha= 0.01 Blood pressure: Reg exercise: low 35, moderate 62, high 25 No reg. Exercise: low 21, moderate 65, high 28 arrow_forwardDoes posting calorie content for menu items affectpeople’s choices in fast-food restaurants? According to results obtained by Elbel, Gyamfi, and Kersh(2011), the answer is no. The researchers monitoredthe calorie content of food purchases for children andadolescents in four large fast-food chains before andafter mandatory labeling began in New York City. Although most of the adolescents reported noticing thecalorie labels, apparently the labels had no effect ontheir choices. Data similar to the results obtained showan average of M = 786 calories per meal with s =85 for n =100 children and adolescents before thelabeling, compared to an average of M = 772 calorieswith s = 91 for a similar sample of n = 100 after themandatory posting.a. Use a two-tailed test with a = .05 to determinewhether the mean number of calories after theposting is significantly different than before caloriecontent was posted.b. Calculate r2to measure effect size for the mean difference.arrow_forward
 Holt Mcdougal Larson Pre-algebra: Student Edition...AlgebraISBN:9780547587776Author:HOLT MCDOUGALPublisher:HOLT MCDOUGAL