
Concept explainers
Videos
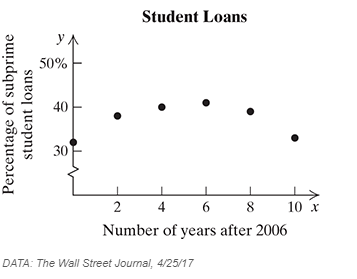
b Choosing Models. For the scatterplots and graphs in Exercises 19–26, determine which, if any, of the following functions might be used as a model for the data: Linear
Want to see the full answer?
Check out a sample textbook solution
Chapter 7 Solutions
EBK INTERMEDIATE ALGEBRA


- Suppose that while driving a car, the driver suddenly sees an animal standing in the road. The driver's brain registers the information and sends a signal to the driver's foot to hit the brake. The car travels a distance D, in feet, during this time, where D is a function of the speed r, in miles per hour, of the car when the driver sees 13 the animal. That reaction distance is a linear function given by D(r) = 10+ 5. Complete parts a through c below. a) Find the slope of this line and interpret its meaning in this application. Select the correct choice below and, if necessary, fill in the answer boxes to complete your choice. O A. The slope m is |. For each mile per hour faster that the car travels, it takes feet longer to stop. O B. The slope is not defined. For each mile per hour faster that the car travels, it takes 0 foot longer to stop.arrow_forwardToesdon 3: The U.S. Bureau of the Census predicted that the population of Florida would be about 16.4 million in 2010 and then would increase by about 0.35 million per year until 2015. Write a linear 201er that predicts the population, y, of Florida (in millions) in terms of x, the number of years since 2010. wurla Jaum uoY sod o no 2odunlo eniwollot orli storw Tedos A:l noltesuD vdw nisloxaarrow_forwardA collector of antique clocks sold at auction believes that the price received for the clocks may be modeled as a linear function of the age of the clocks and the number of bidders at the auction. After a preliminary study and collection of 32 observations, the collector came up with the following second-order model: y = BO+B₁x₁+B₂x₂ + ß3 x1x2 +B4x² +ɛ, where y: price of a clock; x₁: age of a clock; x2: the number of bidders. Considering the output below and by setting a = 0.05, answer the following questions. The regression equation is Price = 262 +2.26 Age + 14.2 Bidder + 1.13 AgeBid 4.20 Bid^2 Predictor Constant -261.7 2.260 14.21 Age Bidder AgeBid Bid^2 S = 84.512 Coef SE Coef 1.1301 -4.196 Analysis of Variance Source 404.4 2.052 R-Sq= 96.0% Variable Age Bidder AgeBid Bid^2 60.83 0.23 5.17 0.000 0.219 1.344 -3.12 0.004 R-Sq (adj) DF Regression 4 4606950 Residual Error 27 192840 Total 31 4799790 SS T P -0.65 0.523 1.10 0.280 0.817 a. Is the model useful as a whole? Apply an…arrow_forward
- Part 3 of 5 (c) Use the data points (4, 1.4) and (28, 2.6) to find an equation of the line through these points. Express numbers as decimals or integers. Write the answer in slope-intercept form (y=mx+b). The equation is 0=0 Ś Xarrow_forwardAt the BMV, suppose that the length of time you must wait before speaking to a customer service representative is linearly related to the number of people who are in line in front of you. If there are 8 people in line in front of you, you will wait 44 minutes, and if there are 14 people in front of you, you will wait 68 minutes. How long will you wait if there are 10 people in front of you?arrow_forwardThe data (d) in MB used to broadcast the call-out depends on the time (t) it takes (in min) to broadcast the message. The data used by the 3 platforms are given below. Check the box(es) that correspond(s) to the platform(s) that consume data linearly. Find the maximum amount of data consumed in 2 min between these platforms. Write your answer in the boxes given below. 3 d = 22 + 8t d = 42t -18 d = (3t)(5t) Maximum data consumed %3D MBarrow_forward
 Algebra & Trigonometry with Analytic GeometryAlgebraISBN:9781133382119Author:SwokowskiPublisher:Cengage
 Big Ideas Math A Bridge To Success Algebra 1: Stu...AlgebraISBN:9781680331141Author:HOUGHTON MIFFLIN HARCOURTPublisher:Houghton Mifflin Harcourt