
APPLICATIONS+INVESTIGATIONS IN EARTH
18th Edition
ISBN: 9781533902405
Author: Tarbuck
Publisher: Hayden-McNeil Publishing
expand_more
expand_more
format_list_bulleted
Textbook Question
Chapter 7.7, Problem 1A
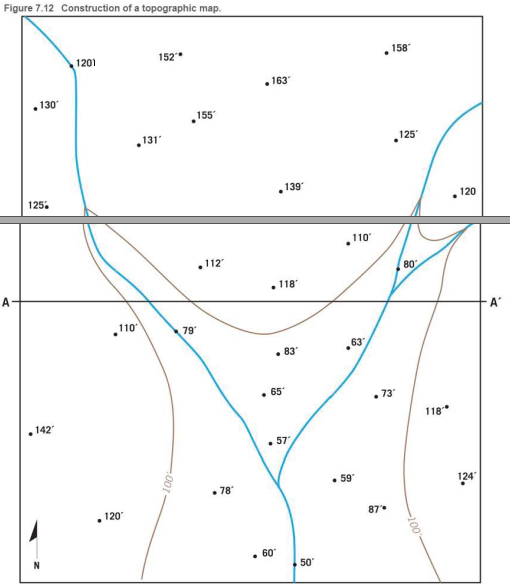
Use the elevations in Figure 7.12 as a guide for drawing contour lines. The 100-foot contour line is provided for reference. Using a 20-foot contour interval, use a pencil to draw a contour line for each 20-foot change in elevation below and above 100 feet (eg. 60 feet, 80 feet, 120 feet) You will have to estimate the elevations between the points. Label each contour line with its elevation
Expert Solution & Answer

Learn your wayIncludes step-by-step video

schedule01:55
Students have asked these similar questions
I need to calculate the horizontal and vertical analysis for the following image that is attached.
During computation, you may round your integer data to two decimal places and your percentages and present value factors to four decimal places.
The figure above is an example of __________.
A.
line chart
B.
candlestick chart
C.
moving average line
D.
Bollinger band
Chapter 7 Solutions
APPLICATIONS+INVESTIGATIONS IN EARTH
Ch. 7.1 - Obtain a stereoscope from your instructor, unfold...Ch. 7.1 - Prob. 2ACh. 7.1 - Prob. 3ACh. 7.1 - Prob. 4ACh. 7.2 - Prob. 1ACh. 7.2 - Prob. 2ACh. 7.3 - Prob. 1ACh. 7.3 - Prob. 3ACh. 7.3 - Prob. 6ACh. 7.4 - Depending on the map scale, 1 inch on a...
Ch. 7.4 - Examine Figure 7.6 and complete the map...Ch. 7.6 - The difference in elevation between adjacent...Ch. 7.6 - What is the difference in elevation between Points...Ch. 7.6 - Notice that every fifth contour line, called an...Ch. 7.6 - Prob. 4ACh. 7.6 - One or more roughly circular closed contours...Ch. 7.6 - Closed contours with hachures short lines that...Ch. 7.6 - When contour lines cross streams or dry stream...Ch. 7.6 - Estimating the elevations of places not located on...Ch. 7.6 - Relief is defined as the difference in elevation...Ch. 7.7 - Use the elevations in Figure 7.12 as a guide for...Ch. 7.7 - Does the land shown on the topographic map you...Ch. 7.7 - Use the profile graph in Figure 7.14 to construct...Ch. 7.8 - Use the profile graph in Figure 7.14 to construct...Ch. 7.9 - What is the contour interval of this map?Ch. 7.9 - What is the difference in elevation from one index...Ch. 7.9 - Prob. 3ACh. 7.9 - Locate the small intermittent stream blue dashed...Ch. 7.9 - What is the approximate elevation of the point...Ch. 7.9 - What is the approximate relief between point X and...Ch. 7.9 - Which of the following phrases best describes the...Ch. 7.9 - The area on both sides of Tennessee Creek in...Ch. 7.9 - Describe the change in elevation you would...Ch. 7.9 - What is the elevation of the town of Leadville,...Ch. 7.9 - Prob. 11ACh. 7 - Determine the contour interval used on this map...Ch. 7 - List the elevations of each index contour on the...Ch. 7 - What are the elevations of the locations...Ch. 7 - What is the elevation of the church? Elevation of...Ch. 7 - Indicate two areas on this map that have steep...Ch. 7 - Describe the relief of Sandy Spit with one of the...Ch. 7 - Mark the top of the hill in the northeast corner...Ch. 7 - Is the top of Picture Ridge, designated Y, at a...Ch. 7 - What is the maximum relief shown on this contour...Ch. 7 - Imagine that you are taking a group of friends...Ch. 7 - Use the satellite images in figure 7.17, which...
Additional Business Textbook Solutions
Find more solutions based on key concepts
Thinking about the radiation laws, why does outgoing long-wave radiation from Earth’s surface exceed the long-w...
Exercises for Weather & Climate (9th Edition)
Why does the coolest temperature of the day occur about sunrise?
Applications and Investigations in Earth Science (8th Edition)
38. ǁ A car sitting at a red light begins to accelerate at 2 m/s2 when the light turns green. It continues with...
College Physics (10th Edition)
Why might H2 metabolism have evolved as a mechanism for energy conservation in the earliest organisms on Earth?
Brock Biology of Microorganisms (14th Edition)
QUANTITATIVE Punnett Squares as Genetic Tools. The genetic characters of seed color (where Y is the allele for ...
Becker's World of the Cell (9th Edition)
Knowledge Booster

Similar questions
- Based on the outcome of the calculations(image attached), draw the five (5) S-Curves for the individual.arrow_forwardGIVEN THE FOLLOWING DATA, COMPUTE FOR THE FOLLOWING: 1. STRAIGHT LINE METHOD 2. ARITHMETIC GEOMETRIC CURVE 3. STATISTICAL PARABOLIC CURVE WRITE A RECOMMENDATION REGARDING THE RESULTS AND WHICH OF THE NETHOD IS BEST FIT FOR THE DATA. Nate: answer on a separate document. Use excel in compute. 2. Supposed this is Yc (straightline) 450,000 370,000 750,000 1,100,000 1,500,000 1,000,000 1,700,000 2,000,000 1,900,000 2,300,000 Yi + 1 (Geometric) YEAR SALES 415,000 1 356,000 703,556 1,023,400 1,308,905 900,573 1,504,789 1,705,932 1,895,890 2,094,256 450,000 370,000 750,000 1,100,000 1,500,000 1,000,000 1,700,000 2,000,000 1,900,000 2,300,000 2011 2012 2013 3 2014 4. 2015 2016 6. 2017 2018 8 2019 2020 10arrow_forwardPlease match the answer to the answe in green box in the image. Please answer step by step how you got all the numbers and the calculations you did provide in detail.arrow_forward
- Please read the first picutre, and answer on the second picture. thanks for your timearrow_forwardI need help with starting the calculations for the following two questions.arrow_forwardIn the context of of cubic interpolation as discussed in the lecture, in order to find the cubic interpolating line one must use parsimonious methods solve a linear system where the unknow variable is time. must solve a linear system in two equations a two varibles. select four rates. solve a cubic system. solve a cubic system of four equations in four variable where the unknown is time select two rates find the slope and the intercept of the interpolating line ☐ approximate the term structurearrow_forward
- Discuss the relationship between CAPM Model and Fama and French (1993) three factors model with the index models. Give correct step by step typed answer with proper explanation of it. Will give upvote only for the correct answer. Answer within 40 min maximum . Thank you .arrow_forwardUse the percentage-completion method and show all calculations and explanation in detail.arrow_forwardFill out the percentages column and the yellow and green bottom. Need verification. Show formula/calculationsarrow_forward
- How do I make a blance sheet using the adjusted trail balance?arrow_forwardConsider the following time series data: Construct a time series plot. What type of pattern exists in the data? Develop a three-week moving average for this time series. Compute MSE and a forecast for week 7. Use α = 0.2 to compute the exponential smoothing values for the time series. Compute MSE and a forecast for week 7. Compare the three-week moving average forecast with the exponential smoothing forecast using α = 0.2. Which appears to provide the better forecast based on MSE? Explain. Use trial and error to find a value of the exponential smoothing coefficient α that results in a smaller MSE than what you calculated for α = 0.2.arrow_forwardCould you include the formulas used for all the blue squares.arrow_forward
arrow_back_ios
SEE MORE QUESTIONS
arrow_forward_ios
Recommended textbooks for you
 Essentials of Business Analytics (MindTap Course ...StatisticsISBN:9781305627734Author:Jeffrey D. Camm, James J. Cochran, Michael J. Fry, Jeffrey W. Ohlmann, David R. AndersonPublisher:Cengage Learning
Essentials of Business Analytics (MindTap Course ...
Statistics
ISBN:9781305627734
Author:Jeffrey D. Camm, James J. Cochran, Michael J. Fry, Jeffrey W. Ohlmann, David R. Anderson
Publisher:Cengage Learning