
Concept explainers
Videos
Temperature data Hourly temperature data for Boulder, Colorado. San Francisco, California. Nantucket, Massachusetts, and Duluth, Minnesota, over a 12 hr period on the same day of January are shown in the figure. Assume that these data are taken from a continuous temperature function T(t). The average temperature over the 12-hr period is
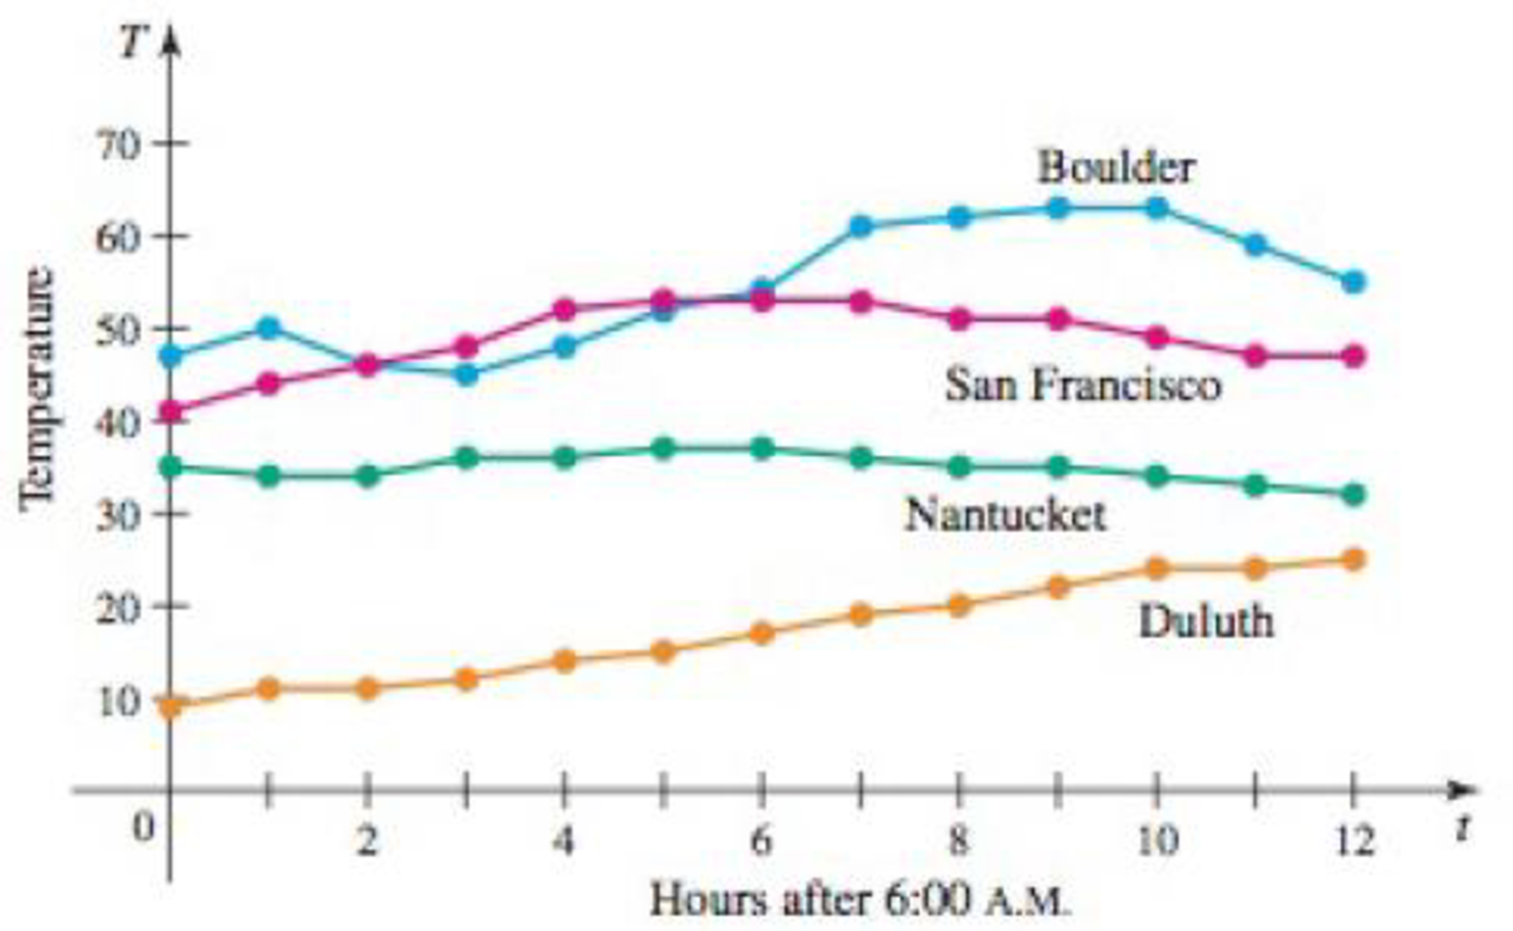
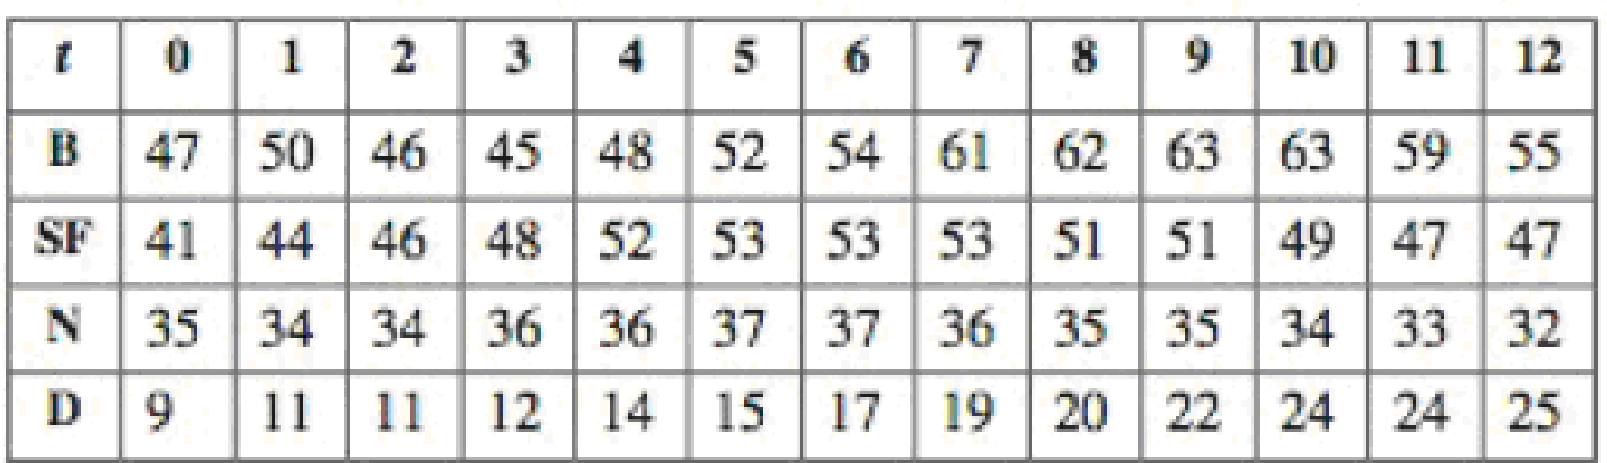
30. Find an accurate approximation to the average temperature over the 12-hr period for Duluth. State your method.

Trending nowThis is a popular solution!

Chapter 7 Solutions
CODE/CALC ET 3-HOLE
Additional Engineering Textbook Solutions
University Calculus: Early Transcendentals (4th Edition)
Calculus & Its Applications (14th Edition)
Glencoe Math Accelerated, Student Edition
Thomas' Calculus: Early Transcendentals (14th Edition)
Calculus and Its Applications (11th Edition)


- The width of a rectangular piece of land is measured to be 48.25ft,if the measurement has a relative error of T of at most 2%,then what is an upper bound for the absolute error? Suppose the ambient temperature is A = 76.2° ± 0.4°F. In what interval does the true temperature lie?arrow_forwardINTRODUCTION: Heat conduction from a cylindrical solid wall of a pipe can be determined by the follow T1-T2 q = 2nLk R2 In R. where: q is the computed heat conduction in Watts. k is the thermal conductivity of the pipe material in Watts/°C/m. L is the length of the pipe in cm. Ri is the inner radius of the pipe in cm. R2 is the outer radius of the pipe in cm. Ti is the internal temperature in °C. T2 is the external temperature in °C. ASSIGNMENT: Write a C program that will allow the user to enter the inner and outer radii of the pipe, the the internal and external temperatures. Once the user enters the input values, the programarrow_forwardThe maximum daily temperature (in F) for Chicago and San Francisco during the month of August 2009 are given in the vectors below (data from the U.S. National Oceanic and Atmospheric Administration). TCH = [75 79 86 86 79 81 73 89 91 86 81 82 86 88 89 90 82 84 81 79 73 69 73 79 82 72 66 71 69 66 66] TSF = [69 68 70 73 72 71 69 76 85 87 74 84 76 68 79 75 68 68 73 72 79 68 68 69 71 70 89 95 90 66 69] Write a program in a script file to answer the following: (a) Calculate the average temperature for the month in each city. (b) How many days was the temperature above the average in each city? (c) How many days was the temperature in San Francisco lower than the temperature in Chicago? (d) How many days was the temperature the same in both cities?arrow_forward
- There are two isotopes of an unknown element, X-19 and X-21. The abundance of X-19 is 14.29%. A weighted average uses the percentages of each isotope to scale their contribution to the total mass. Each isotope's contribution is the percentage (in decimal form) multiplied by the mass of the isotope. What is the contribution (in amu) to the weighted average from the X-19 isotope, which has a mass of 19.00 amu?arrow_forward: Growth data of a sunflower plant is given in the following table: Day 7 21 35 49 63 77 91 Height (in.) 8.5 21 50 77 89 98 99 (a) Curve-fit the data with a third-order polynomial. Use the polynomial to estimate the height in day 40. (b) Fit the data with linear and spline interpolations and use each interpolation to estimate the height in day 40.arrow_forwardIncident Computation The sum of the years “at risk” of these 12 courses is 102 students-years, and there were 3 occurrence of disease. We can now compute the incident rate: (One decimal place only. No need to include “%” sign to your answer.)arrow_forward
- Suppose that the local power company wants to predict electricity demand for the next 5 days. They have the data about daily demand for the last 5 years. Typically, the demand will be a number between 80 and 400. a) Describe how you could use an MLP to make the prediction. What parameters would you have to choose, and what do you think would be sensible values for them? b) If the weather forecast for the next day, being the estimated temperatures for daytime and nighttime, was available, how would you add that into your system? c) Do you think that this system would work well for predicting power consumption? Are there demands that it would not be able to predict? MLP stands for Multilayer perceptron.arrow_forwardThe fuel economy of a car is the distance which it can travel on one litre of fuel. The base fuel economy (i.e., its fuel economy when there is only one person - the driver - in the car) of a certain car is MM kilometres per litre. It was also observed that every extra passenger in the car decreases the fuel economy by 11 kilometre per litre. PP people want to take this car for a journey. They know that the car currently has VV litres of fuel in its tank. What is the maximum distance this car can travel under the given conditions, assuming that all PP people always stay in the car and no refuelling can be done? Note that among the PP people is also a driver, i.e., there are exactly PP people in the car. Solve in any programming languagearrow_forwardThe table below describes the average voltage generated, A, in volts by an energy harvester for three days at three different times for each day. Referenced time Day 3. 3.0 V 1.8 V 0.9 V 1.9 V 2.2 V 1.7 V 0.5 V 1.1 V 2.2 V Given that the power generated in millivwatts (mW), P, can be calculated using the following equation: 500A? P = Where A is the voltage generated and R is the total resistance given as 2000 Q. Write a MATLAB/OCTAVE script to store the voltage data from the table as a single matrix, where the days represent the rows and the referenced times represent the columns of the matrix. Hence, in the same script, Calculate the power generated at each day and referenced time. i) ii) Compute and output the overall maximum power generated. Finally, compute and output the days and referenced times where the power generated exceeds 1.0 mW (Tips: You may want to use a nested loop OR the in-built MATLAB/OCTAVE function called 'find' here) iii)arrow_forward
- The daily high temperature (°F) in New York City and Denver, Colorado during the month of January 2004 is given in the vectors below (data from the U.S. National Oceanic and Atmospheric Administration). NYC = [33 33 18 29 40 55 19 22 32 37 58 54 51 52 45 41 45 39 36 45 33 18 19 19 28 34 44 21 23 30 39] DEN = [39 48 61 39 14 37 43 38 46 39 55 46 46 39 54 45 52 52 62 45 62 40 25 57 60 57 20 32 50 48 28] Where, the elements in the vectors are in the order of the days in the month. Write a program in a script file that determines and displays the following information: (a) The average temperature for the month in each city (rounded to the nearest degree). (b) The number of days that the temperature was above the average in each city. (c) The number of days that the temperature in Denver was higher than the temperature in New York.arrow_forwardUse generating functions to find the number of solutions to the equation a+b+c+d=50 if each variable is a non-negative integer.arrow_forwardA town wishes to build a trail between city A, city B, city C, city D, and city E. The distances, in miles, between any two of the destinations are given in the table. Use the table to answer parts (a) and (b) below. A B C D E A * 154 134 216 129 B 154 * 195 51 243 C 134 195 * 225 220 D 216 51 225 * 308 E 129 243 220 308 * a) Use Kruskal's algorithm to determine the minimum-cost spanning tree that would link each location to create the least expensive trail. Choose the correct graph below. A. ABCD154216225E129 B. ABCD15419551E129 C. ABCD15413451E129 D. ABCD154134216E129 b) If the cost of building such a trail is $3700 per mile, what is the cost of building the trail determined in part (a)? The cost is:arrow_forward
 Database System ConceptsComputer ScienceISBN:9780078022159Author:Abraham Silberschatz Professor, Henry F. Korth, S. SudarshanPublisher:McGraw-Hill Education
 Starting Out with Python (4th Edition)Computer ScienceISBN:9780134444321Author:Tony GaddisPublisher:PEARSON
 Digital Fundamentals (11th Edition)Computer ScienceISBN:9780132737968Author:Thomas L. FloydPublisher:PEARSON
 C How to Program (8th Edition)Computer ScienceISBN:9780133976892Author:Paul J. Deitel, Harvey DeitelPublisher:PEARSON
 Database Systems: Design, Implementation, & Manag...Computer ScienceISBN:9781337627900Author:Carlos Coronel, Steven MorrisPublisher:Cengage Learning
 Programmable Logic ControllersComputer ScienceISBN:9780073373843Author:Frank D. PetruzellaPublisher:McGraw-Hill Education