
a)
The Correctly labeled graph that shows the points from 0% to 100% of the population on the Lorenz curve before the redistribution of income.
a)
Explanation of Solution
Before the redistribution of income, the population included 100 households and income was 2 million who earn their share according to the proportion of poor from 0% to 100% which can be shown on the Lorenz curve as follows:
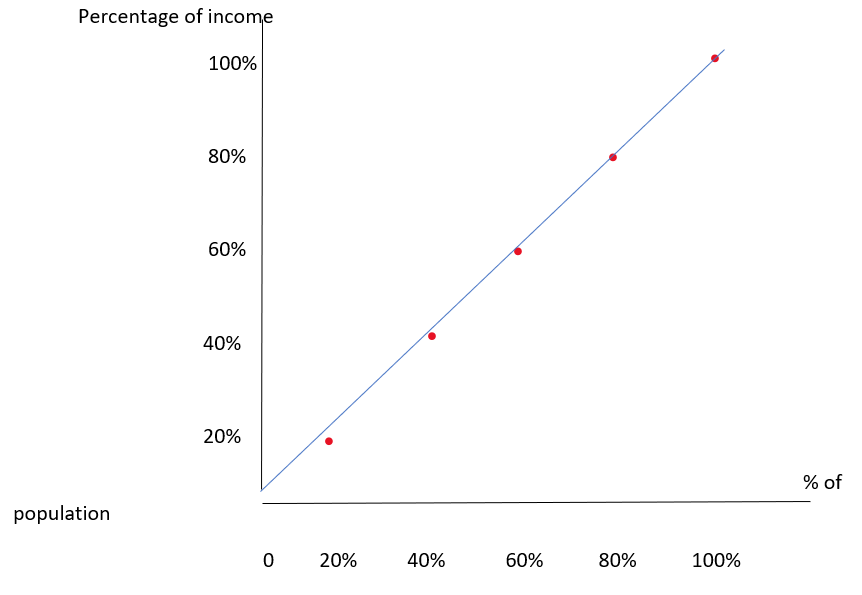
Here, 20% of the population earns 20% of the total income and 40% of the population earns 40% of the income and this income is in the same proportion up to 100%.
Introduction: Total income is the gross income of a country from all sources of revenue that subtract some deductions such as expenses and allowances.
The Lorenz curve shows the graphical representation of inequality in income and inequality in wealth which was developed by Max Lorenz.
b)
The correctly labeled graph that shows the points from 0% to 100% of the population on the Lorenz curve after the redistribution of income
b)
Explanation of Solution
After the redistribution of income, the population included 100 households and the total income was also the same which was 2 million. Here, people earn their share according to the proportion of poor from 0% to 100% which can be shown on the Lorenz curve as similar to the previous graph:
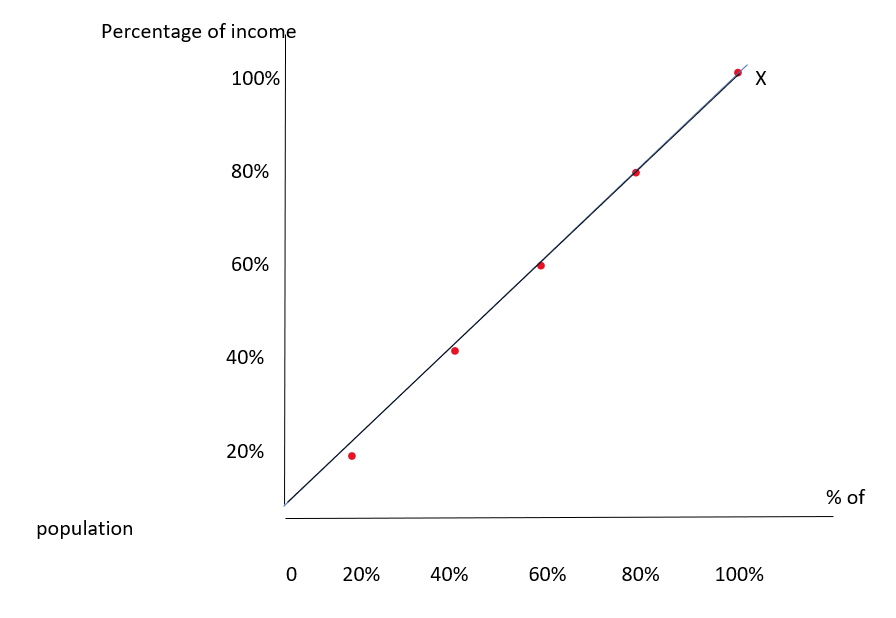
Here, 20% of the population earns 20% of the total income and 40% of the population earns 40% of the income and this income is in the same proportion up to 100%. The graph shows a similar proportion because there is no change in total income and the number of households after the redistribution of income.
Introduction: Total income is the gross income of a country from all sources of revenue that subtract some deductions such as expenses and allowances. The amount of income, where one group of the population earns income below that amount and one group earns above that amount refers to the median income. Whereas, mean income is the average income of the population.
The Lorenz curve shows the graphical representation of inequality in income and inequality in wealth which was developed by Max Lorenz.
c)
The Gini coefficient after the redistribution of income
c)
Explanation of Solution
In this case, the Gini coefficient would be zero because there is no gap between the Lorenz curve and the equality line. As all the members receive an equal proportion of income after the distribution which means there is no inequality of income distribution. It does not show any difference between the equality line and the Lorenz curve. Therefore, the Gini coefficient would be zero.
Introduction: Total income is the gross income of a country from all sources of revenue that subtract some deductions such as expenses and allowances.
The Lorenz curve shows the graphical representation of inequality in income and inequality in wealth which was developed by Max Lorenz.
The Gini coefficient refers to the measurement of the inequality among values of a frequency distribution which is developed by Corrado Gini and it covers the distribution of income and distribution of wealth such as the levels of income.
Chapter 78 Solutions
Krugman's Economics For The Ap® Course


 Principles of Economics (12th Edition)EconomicsISBN:9780134078779Author:Karl E. Case, Ray C. Fair, Sharon E. OsterPublisher:PEARSON
 Engineering Economy (17th Edition)EconomicsISBN:9780134870069Author:William G. Sullivan, Elin M. Wicks, C. Patrick KoellingPublisher:PEARSON
 Principles of Economics (MindTap Course List)EconomicsISBN:9781305585126Author:N. Gregory MankiwPublisher:Cengage Learning
 Managerial Economics: A Problem Solving ApproachEconomicsISBN:9781337106665Author:Luke M. Froeb, Brian T. McCann, Michael R. Ward, Mike ShorPublisher:Cengage Learning
 Managerial Economics & Business Strategy (Mcgraw-...EconomicsISBN:9781259290619Author:Michael Baye, Jeff PrincePublisher:McGraw-Hill Education