
Subpart (a):
Equilibrium price .
Subpart (a):
Explanation of Solution
The equilibrium price and the quantity are determined at the interaction of the demand curve and the supply curve of the commodity in the market. When the demand and supply for the commodity are equal at a particular price point, the point will be the equilibrium price level and the
We have given the supply equation and the demand equations and we can equate them in order to obtain the equilibrium price as follows:
Thus, the equilibrium price is $100. Now we can calculate the equilibrium quantity by substituting the equilibrium price in the equations as follows:
Thus, the equilibrium quantity is 200 units.
Concept introduction:
Equilibrium: It is the
Subpart (b):
Equilibrium price.
Subpart (b):
Explanation of Solution
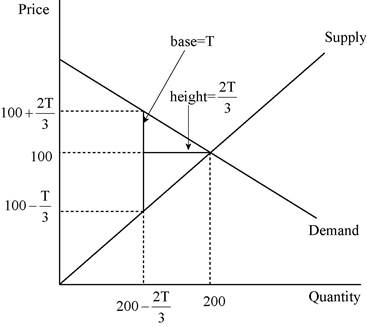
We have given the supply equation and the demand equation changes due to the tax on consumers and the new demand equation is
Thus, the price received by the producers is
Thus, the quantity is now
Concept introduction:
Equilibrium: It is the market equilibrium which is determined by equating the supply to the demand. At this equilibrium point, the supply will be equal to the demand and there will be no excess demand or excess supply in the economy. Thus, the economy will be at equilibrium.
Subpart (c):
Total tax revenue.
Subpart (c):
Explanation of Solution
We have given that the tax revenue equals to the tax rate multiplied with the quantity. The quantity is calculated in part b as
This relation between the tax revenue can be illustrated as follows:
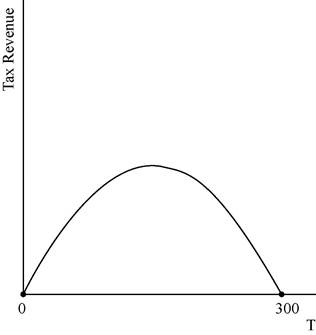
The graph depicts that the tax revenue will be zero at the tax levels of T = $0 and also at the tax rate of T = $300.
Concept introduction:
Tax: It is the unilateral payment made by the public towards the government. There are many different types of taxes in the economy which include the income tax, property tax and professional tax and so forth.
Tax revenue: Tax revenue refers to the total revenue earned by the government through imposing tax.
Subpart (d):
Deadweight loss .
Subpart (d):
Explanation of Solution
We have given that deadweight loss is the area of the triangle between the demand and supply curves. The following diagram shows, the area of the triangle (laid on its side) that represents the deadweight loss is 1/2 × base × height, where the base is the change in the price, which is the size of the tax (T) and the height is the amount of the decline in quantity (
The deadweight loss can be calculated as follows:
Thus, the deadweight loss is equal to
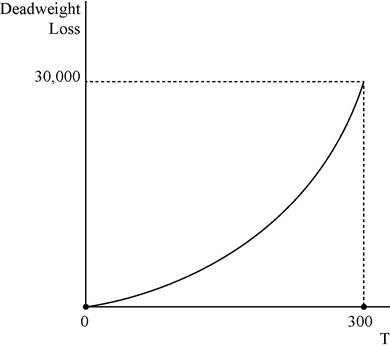
In the above diagram horizontal axis measures quantity and vertical axis measures deadweight loss.
Concept introduction:
Tax: It is the unilateral payment made by the public towards the government. There are many different types of taxes in the economy which include the income tax, property tax and professional tax and so forth.
Deadweight loss: It is the reduction in the units where the marginal benefit to the consumer is higher than the marginal cost of production of the unit.
Subpart (e):
Determine the tax amount.
Subpart (e):
Explanation of Solution
A tax of $200 will not turn out to be a good policy because the tax revenue decreases when the tax rate reaches to $300 where the tax revenue is zero. The tax revenue is at its maximum at the middle of the tax rate of $0 and $300 which is $150. Thus, in order to increase the tax revenue, the government should reduce the tax rate to $150 from $200 which will be the good alternative policy.
Concept introduction:
Tax: It is the unilateral payment made by the public towards the government. There are many different types of taxes in the economy which include the income tax, property tax and professional tax and so forth.
Want to see more full solutions like this?
Chapter 8 Solutions
Principles of Macroeconomics (MindTap Course List)

- Suppose that a market is described by the following supply and demand equations:Qs=2PQD=300-Pa.Solve for the equilibrium price and the equilibrium quantity.b.Solve that a tax of T is placed on buyers,so the new denad equation is QD=300-(P+T).Solve for the new equilibrium.What happens to the price receive by sellers,the price paid by buyers.and the quantity sold?c.Tax revenue is TxQ.Use your answer from part(b)to solve for tax revenue as a function of T.Graph this relationship for T between 0 and 300.d.The dead weight loss of a tax is the area of a triangle between supply and demand curves.Recalling that the area of the triangle is 1/2xbasexheight,solve for the dead weight loss as afunction of T.Graph this relationship for T between 0 and 300.e.The government now levies a tax of $200per unit on this good.Is this a good policy?Why or why not?Can you propose a better policy?arrow_forwardSubsidies, unlike taxes, tend to increase the quantities of goods and/or services traded and consumers tend to pay a lower price for the good. From this perspective, the benefits for consumers are evident, while the effects for producers are not so conclusive. In this context, what would be the effect(s) that subsidies have on producers?I. Subsidies positively affect the quantity supplied, but the producer must pay the subsidy.II. Market prices increase.III. Producers increase the quantity offered, but the price they charge is the one that corresponds according to their supply function.Select one:a. II and IIIb. III onlyc. I, II and IIId. I and IIIe. I onlyarrow_forwardSuppose the supply of a good is given by the equation QS=600P−1,200 , and the demand for the good is given by the equation QD=1,600−200P , where quantity (Q) is measured in millions of units and price (P) is measured in dollars per unit. The government decides to levy an excise tax of $2.00 per unit on the good, to be paid by the seller. Calculate the value of each of the following, before the tax and after the tax, to complete the table that follows: 1. The equilibrium quantity produced 2. The equilibrium price consumers pay for the good 3. The price received by sellers Before Tax After Tax Equilibrium Quantity (Millions of units) Equilibrium Price per Unit Paid by Consumers Price per Unit Received by Sellers Given the information you calculated in the preceding table, the tax incidence on consumers is per unit of the good, and the tax incidence on producers is per unit of the good. The government receives in tax revenue from levying an excise tax of $2.00 per unit on this good. True…arrow_forward
- Suppose that the government imposes a tax on cigarettes, use the diagram below to answer the questions. D is the demand curve before tax, S is the supply curve before tax and ST is the supply curve after the tax. (a) For the market for cigarettes with the tax, calculate (I) the tax (ii) price paid by consumers (iii) price recieved by producers (iv) quantity of cigarettes soldarrow_forwardAssume that the price of soft drinks is $5 and the government decides instead to impose a $1 tax per soft drink on producers. Assume that the demand for soft drinks is perfectly elastic. Will producers pass on part of the tax to consumers in the form of higher prices? Why? Will the loss of consumer surplus be lower or higher relative to a situation where demand is point inelastic at the equilibrium that exists prior to imposition of the tax?arrow_forward
 Principles of Macroeconomics (MindTap Course List)EconomicsISBN:9781305971509Author:N. Gregory MankiwPublisher:Cengage Learning
 Principles of Microeconomics (MindTap Course List)EconomicsISBN:9781305971493Author:N. Gregory MankiwPublisher:Cengage Learning
 Principles of Macroeconomics (MindTap Course List)EconomicsISBN:9781285165912Author:N. Gregory MankiwPublisher:Cengage Learning
 Essentials of Economics (MindTap Course List)EconomicsISBN:9781337091992Author:N. Gregory MankiwPublisher:Cengage Learning
 Exploring EconomicsEconomicsISBN:9781544336329Author:Robert L. SextonPublisher:SAGE Publications, Inc