
Subpart (a):
Equilibrium price.
Subpart (a):
Explanation of Solution
The equilibrium price and the quantity are determined at the interaction of the demand curve and the supply curve of the commodity in the market. When the
We have given the supply equation and the demand equations and we can equate them in order to obtain the equilibrium price as follows:
Thus, the equilibrium price is $100. Now we can calculate the equilibrium quantity by substituting the equilibrium price in the equations as follows:
Thus, the equilibrium quantity is 200 units.
Concept introduction:
Equilibrium: It is the
Subpart (b):
Equilibrium price.
Subpart (b):
Explanation of Solution
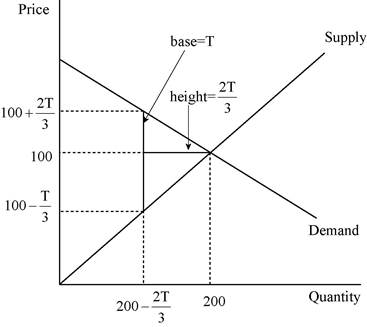
We have given the supply equation and the demand equation changes due to the tax on consumers and the new demand equation is
Thus, the price received by the producers is
Thus, the quantity is now
Concept introduction:
Equilibrium: It is the market equilibrium which is determined by equating the supply to the demand. At this equilibrium point, the supply will be equal to the demand and there will be no excess demand or excess supply in the economy. Thus, the economy will be at equilibrium.
Subpart (c):
Total tax revenue.
Subpart (c):
Explanation of Solution
We have given that the tax revenue equals to the tax rate multiplied with the quantity. The quantity is calculated in part b as
This relation between the tax revenue can be illustrated as follows:
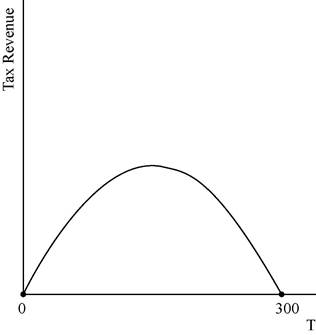
The graph depicts that the tax revenue will be zero at the tax levels of T = $0 and also at the tax rate of T = $300.
Concept introduction:
Tax: It is the unilateral payment made by the public towards the government. There are many different types of taxes in the economy which include the income tax, property tax and professional tax and so forth.
Tax revenue: Tax revenue refers to the total revenue earned by the government through imposing tax.
Subpart (d):
Deadweight loss .
Subpart (d):
Explanation of Solution
We have given that deadweight loss is the area of the triangle between the demand and supply curves. The following diagram shows, the area of the triangle (laid on its side) that represents the deadweight loss is 1/2 × base × height, where the base is the change in the price, which is the size of the tax (T) and the height is the amount of the decline in quantity (
The deadweight loss can be calculated as follows:
Thus, the deadweight loss is equal to
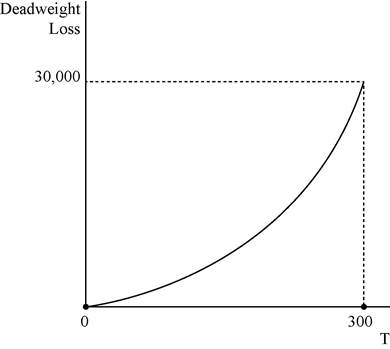
In the above diagram horizontal axis measures quantity and vertical axis measures deadweight loss.
Concept introduction:
Tax: It is the unilateral payment made by the public towards the government. There are many different types of taxes in the economy which include the income tax, property tax and professional tax and so forth.
Deadweight loss: It is the reduction in the units where the marginal benefit to the consumer is higher than the marginal cost of production of the unit.
Subpart (e):
Determine the tax amount.
Subpart (e):
Explanation of Solution
A tax of $200 will not turn out to be a good policy because the tax revenue decreases when the tax rate reaches to $300 where the tax revenue is zero. The tax revenue is at its maximum at the middle of the tax rate of $0 and $300 which is $150. Thus, in order to increase the tax revenue, the government should reduce the tax rate to $150 from $200 which will be the good alternative policy.
Concept introduction:
Tax: It is the unilateral payment made by the public towards the government. There are many different types of taxes in the economy which include the income tax, property tax and professional tax and so forth.
Want to see more full solutions like this?
Chapter 8 Solutions
EBK STUDY GUIDE FOR MANKIW'S PRINCIPLES

- In a market where the supply curve is perfectly inelastic how does an excise tax affect the price paid by consumers and the quantity bought and sold?arrow_forward1.Given the following information Qd= 240 – 5p Qs= P Where Qd is the quantity demanded, Qs is the quantity supplied and P is the price. Suppose that the government decides to impose a tax of $12 per unit on sellers in this market. What is the buyer’s price after tax?arrow_forwardThe demand and supply equations for a product are: Q^d=300-6p and Q^x=-40+6p. . Determine the market Equilibrium and draw graphs. Suppose that the government decides to impose a flat tax of 10% on each unit sold. Show that the price that consumers pay would be the same if the government imposed a tax of Rs. 1.70 per unit sold. Draw graph and explain . Also calculate the total revenue earned by sellers before and after the tax, the tax revenue raised by the government, changes in consumer and producers surplus and dead weight lossarrow_forward
- Suppose the market demand for milk is Qd = 40 – 4P Where Qd is millions of gallons demanded and P is price per gallon. Suppose the market supply for milk is Qs = - 40/3 + 20/3P Suppose a tax of $1 per gallon of milk is imposed in this market. What is the new price paid by consumers and What is the quantity of milk sold? *Hint: It does not matter if the tax is collected from purchasers or sellers.arrow_forwardThe demand and supply equations for a product are: Qd = 300 - 6P and Qs = -40 + 6P. Determine the market equilibrium and draw graphs. Suppose that the government decides to impose a flat tax of 10% on each unit sold. Show that the price that consumer pay would be the same if the government imposed a tax of Rs. 1.70 per unit sold. Draw graphs and explain. Also calculate the total revenue earned by sellers before and after the tax, the tax revenue raised by the government, changes in consumer and producers surplus and dead weight loss.arrow_forwardConsider the following demand and supply functions:Qd = 80 − 2PQs = −100 + 8P (i) Find the equilibrium price and quantity(ii) Suppose govt. imposes a sales tax of TK.4 per unit, calculate the new equilibrium price and quantity.(iii) Suppose govt. provides subsidy of TK.3 per unit, calculate the new equilibrium price and quantity.arrow_forward
- The demand and supply equations for a product are: Q* = 0.2 300 – 6P and Q' = -40 + 6P. Determine the market equilibrium and draw graphs. Suppose that the government decides to impose a flat tax of 10% on each unit sold. Show that the price that consumers pay would be the same if the government imposed a tax of Rs. 1.70 per unit sold. Draw graphs and explain. Also calculate the total revenue earned by sellers before and after the tax, the tax revenue raised by the government, changes in consumer and producers surplus and dead weight loss.arrow_forwardConsider the following demand and supply functions. Demand: D(p) = q = 169 – 9p and Supply: S(p) = q = 45 + 11p a.) Assume there are no taxes imposed. Find the equilibrium price and quantity. Equilibrium Price (Round your answer to the nearest cent) 6.2 Equilibrium Quantity (Round your answer tothe nearest whole number) 113 b.) Assume there is a 15% tax on the producer, find the new equilibrium price and quantity. New equilibrium price (Round your answer to the nearest cent) Equilibrium Quantity (Round your answer to the nearest whole number) c.) What portion of the tax is paid by the consumer? (Round to the nearest cent) d.) What portion of the tax is paid by the producer? (Round to the nearest cent) e.) What is the total tax is paid to the government? (Round to the nearest cent) Submit answerarrow_forward
 Principles of Microeconomics (MindTap Course List)EconomicsISBN:9781305971493Author:N. Gregory MankiwPublisher:Cengage Learning
 Principles of Macroeconomics (MindTap Course List)EconomicsISBN:9781285165912Author:N. Gregory MankiwPublisher:Cengage Learning
 Essentials of Economics (MindTap Course List)EconomicsISBN:9781337091992Author:N. Gregory MankiwPublisher:Cengage Learning
 Principles of Macroeconomics (MindTap Course List)EconomicsISBN:9781305971509Author:N. Gregory MankiwPublisher:Cengage Learning
 Exploring EconomicsEconomicsISBN:9781544336329Author:Robert L. SextonPublisher:SAGE Publications, Inc