EBK ECONOMICS TODAY
18th Edition
ISBN: 9780133920116
Author: Miller
Publisher: YUZU
expand_more
expand_more
format_list_bulleted
Question
Chapter 8, Problem 18P
To determine
(a)
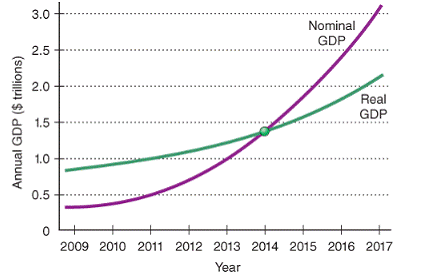
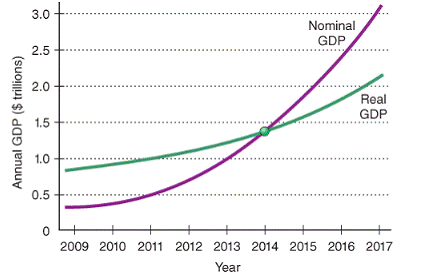
To consider: The given graph and the base year.

To determine
(b)
To consider: The given graph and if the country experienced inflation or deflation since 2014.

Expert Solution & Answer
Want to see the full answer?
Check out a sample textbook solution
Students have asked these similar questions
Calculating Real GDP, Price Indices, and Inflation. Using the data from the table below, answer the following questions:
Quantities Produced
2011
2012
CDs
105
125
Tennis Rackets
210
220
Real GDP in 2011 using 2011 prices is $24255. (Enter your response as an integer.)
Real GDP in 2012 using 2011 prices is $25725. (Enter your response as an integer.)
Real GDP grew by 6.06 percent. (Enter your response as a percentage rounded to two decimal places.)
The price index for GDP (GDP Deflator) for 2012 using 2011 as the base year is
Price per CD
$21
$25
Prices
Price per Tennis Racket
$105
$125
(Enter your response rounded to two decimal places.)
1. Calculating inflation using a simple price index
Consider a fictional price index, the College Student Price Index (CSPI), based on a typical college student's annual purchases. Suppose the following
table shows information on the market basket for the CSPI and the prices of each of the goods in 2017, 2018, and 2019.
The cost of each item in the basket and the total cost of the basket are shown for 2017.
Perform these same calculations for 2018 and 2019, and enter the results in the following table.
2017
2018
2019
Price
Cost
Price
Cost
Price
Cost
Quantity in Basket
(Dollars)
(Dollars)
(Dollars)
(Dollars)
(Dollars)
(Dollars)
Notebooks
15
2
30
8
Calculators
1
70
70
100
130
Large coffees
250
2
500
2
Energy drinks
50
2
100
4
Textbooks
10
120
1,200
150
180
Total cost
1,900
Price index
100
Suppose the base year for this price index is 2017.
The following table gives nominal and real GDP for an economy for two years.
Based on the table, in Year 2, the value of the GDP deflator is
Year 1
1430.0
1,300
Nominal GDP
Real GDP
(Round your answer to one decimal place.)
The inflation rate between Year 1 and Year 2 is %. (Round your answer to one decimal place.)
Year 2
1820.0
1560.0
Chapter 8 Solutions
EBK ECONOMICS TODAY
Ch. 8 - Prob. 8.1LOCh. 8 - Prob. 8.2LOCh. 8 - Prob. 8.3LOCh. 8 - Prob. 8.4LOCh. 8 - Prob. 8.5LOCh. 8 - Prob. aFCTCh. 8 - Prob. bFCTCh. 8 - Prob. cFCTCh. 8 - Prob. dFCTCh. 8 - Prob. eFCT
Ch. 8 - Prob. fFCTCh. 8 - Prob. 1CTQCh. 8 - Prob. 2CTQCh. 8 - Prob. 1FCTCh. 8 - Prob. 2FCTCh. 8 - Prob. 1PCh. 8 - Prob. 2PCh. 8 - Prob. 3PCh. 8 - Prob. 4PCh. 8 - Prob. 5PCh. 8 - Prob. 6PCh. 8 - Prob. 7PCh. 8 - Prob. 8PCh. 8 - Prob. 9PCh. 8 - Prob. 10PCh. 8 - Prob. 11PCh. 8 - Prob. 12PCh. 8 - Prob. 13PCh. 8 - Prob. 14PCh. 8 - Prob. 15PCh. 8 - Prob. 16PCh. 8 - Prob. 17PCh. 8 - Prob. 18P
Knowledge Booster
Similar questions
- This table indicates the historical level of the Consumer Price Index (CPI) for the United States for 1921, 1922, and 1923. Complete the table by (1) selecting the inflation rates for 1922 and 1923, and (2) indicating for each year whether there has been inflation, deflation, or hyperinflation. Year CPI Inflation Rate Change in Price Level 1921 17.9 — — 1922 16.8 1923 17.1 What rates of inflation for 1924 would be consistent with disinflation between 1923 and 1924? Check all that apply. 1.7% 11.8% 51.8% 1.8% What rates of inflation for 1924 would be consistent with hyperinflation? Check all that apply. 15.0% -1.8% 100.0% 120.0%arrow_forwardThe CPI in 1974 equaled 0.49. The CPI in 1975 equaled 0.54. Use the CPI from both years to answer the following two questions. a.) The rate of inflation between 1974 and 1975 was [ Select ] percent. b.) Let's say that average family incomes increased by 8% from 1974 to 1975 in nominal terms. This implies that the average real income for families in 1975 [ Select ] , compared to their purchasing power in 1974.arrow_forwardWhat is the difference between using a measure of inflation such as the consumer prices index (CPI) and the GDP deflator? Which do you think is the more accurate measure of price changes in an economy?arrow_forward
- Bureau of Economic Analysis data show that with base year 2005 = 100, the GDP price index was 109.7 in the second quarter of 2009. In that same quarter, the PCEPI was 108.8. Given the further information that the prices of capital goods (investment) and foreign traded goods (exports and imports) increased at a slower pace than the prices of consumption goods and services, how would you explain the difference in the GDP price index and PCEPI measures of inflation? Choose the correct statement. A. The prices of government goods and services increased at the same pace as the prices of consumption goods. B. The prices of consumption goods increased at a faster pace than the prices of government goods. C. The prices of exports increased at the same pace as the prices of imports. D. The prices of government goods and services increased at a faster pace than the prices of consumption goods. E. The prices of capital goods and foreign traded…arrow_forwardWhy do economists use index numbers to measure the price level rather than dollar value of goods?arrow_forwardCongratulations! Your boss has given you a raise. However, you want to know whether your purchasing power has actually increased, since inflation is rising as well. The table below gives you data for wages and the Consumer Price Index (CPI) for the last two years. Year 1 Year 2 Wage ($/day) $2,000 $2,100 The nominal percentage increase in your wage is%. (Round your answer to one decimal place.) The real percentage increase in your wage is%. (Round your answer to one decimal place.) CPI 115 128.8arrow_forward
- The nominal GDP for 2021 is $125 billion, and the real GDP for 2021 is $100 billion. (1). Calculate the GDP Deflator in 2021? Show your calculation. (2). Also assume that the GDP deflator in 2020 was 100. What is the inflation rate over the 1-year period? Show yourcalculation.arrow_forwardUsing the GDP Deflator calculate the average annual inflation rate that the U.S. experienced over the period beginning with the year of 1998 and ending with 2020. (Note: you do not use the inflation rate as the data you plug into the formula. Rather, you calculate an inflation rate by using the formula.) GDP Deflator: price index in 1998 is 75.3, in 2020 is 113.6 inflation rate in 1998 is 1.1, in 2020 is 1.2 nominal interest rates in 1998 is 6.53, in 2020 is 2.48 Real interest rates in 1998 is 5.41, in 2020 is 1.27arrow_forwardQuestion 1: In an economy, there are only two goods (Cars and cycles) produced. The data for last three years is given in the below table. Calculate the nominal and real GDP of three years and then find the GDP deflator for all the three years. Find year on year (YoY) inflation for 2018 and 2019. Note: the base year for this economy is given as 2017. year Price of Car (AED) Number of Car Price of cycle (AED) Number of cycle 2017 1000 10 200 900 2018 1200 15 210 1000 2019 1500 25 250 1500 Question 2: Explain the role of fiscal and monetary policy in an economy facing a recession. Use appropriate graph to justify your answerarrow_forward
- Question 2 1 pts You have the following relationship between unemployment and GDP: u = 7.6 - 0.75(Y - 1000). If Y is 995$, how much is the natural rate of unemployment? What your answer as a percentage, round at one (1) decimal, but do not write the percentage sign.arrow_forward1) If nominal GDP is $7636.0 billion and the GDP deflator is 130.2, then what is real GDP? 2) If the Consumer Price Index rose from 166.3 in 1985 to 380.1 in 2010, what would be the inflation rate over this period?arrow_forwardQuestion 2 Complete the following table for a given country and show how can you determine if the country faces an inflation in 2018? Nominal GDP2017 Nominal GDP2018 Real GDP2018 P P P 4 2 3 4 3 3 4 3 6 2 GDParrow_forward
arrow_back_ios
SEE MORE QUESTIONS
arrow_forward_ios
Recommended textbooks for you
 Exploring EconomicsEconomicsISBN:9781544336329Author:Robert L. SextonPublisher:SAGE Publications, Inc


 Economics Today and Tomorrow, Student EditionEconomicsISBN:9780078747663Author:McGraw-HillPublisher:Glencoe/McGraw-Hill School Pub Co

Exploring Economics
Economics
ISBN:9781544336329
Author:Robert L. Sexton
Publisher:SAGE Publications, Inc


Economics Today and Tomorrow, Student Edition
Economics
ISBN:9780078747663
Author:McGraw-Hill
Publisher:Glencoe/McGraw-Hill School Pub Co