
Effect on cycle length due to
Answer to Problem 18P
Cycle length value increases with
Explanation of Solution
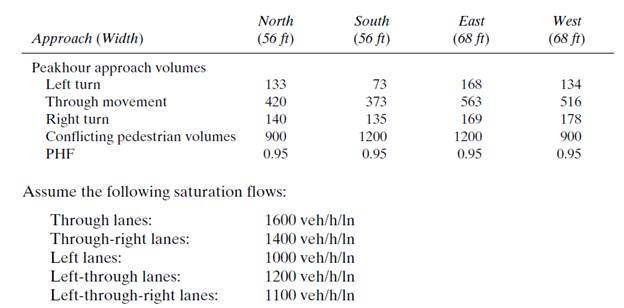
Given data:
Calculation:
Evaluating equivalent hourly flow −
Similarly, evaluating equivalent hourly flow for all traffic movements −
Table 1
| Approach (width) | N (56ft) | S (56ft) | E (68ft) | W (68ft) |
| Left turn | 133/0.95 = 140 | 73/0.95 = 77 | 168/0.95 = 177 | 134/0.95 = 142 |
| Through movement | 443 | 393 | 593 | 544 |
| Right turn | 148 | 143 | 178 | 188 |
| Conflicting pedestrian volume | 948 | 1264 | 1264 | 948 |
Assuming lane configuration as one dedicated left turn and combined through and right lane −
Table 2
| Approach | N | S | E | W |
| Left | 140 | 77 | 177 | 142 |
| Through + Right | 589 (442+147) | 535 (393+178) | 771 (593+178) | 730 (543+187) |
Assume a phase scheme and find critical ratios(
Table 3
| - | Phase lE-W (Left) | Phase llE-W (Through) | Phase lllN-S (Left) | Phase lVN-S (Through) |
| 177 | 771 | 140 | 589 | |
| 1000 | 3000 (1600+1400) | 1000 | 3000 (1600+1400) | |
| 0.177 | 0.257 | 0.140 | 0.196 |
Sum of critical ratios −
Assuming lost time per phase (
So, Total lost time −
Now, determining the optimum cycle length −
(Cycle lengths are generally multiple of
Finding Total effective green time −
Effective time for phase
For Phase l
(Assuming yellow time as
For Phase ll
For Phase lll
For Phase lV
Table 4
| Phase | Allocated green & yellow time (in sec) |
Total cycle length
Green time required for pedestrian crossing can be calculated as following formula:
(Assuming the crosswalk width as
Where,
Calculating
Calculating minimum time required (
Minimum time required for N approach (
Minimum time required for S approach (
Minimum time required for E approach (
Minimum time required for W approach (
Table 5
| Phase | Minimum green time (in sec) |
Sum of green and yellow time is given by,
Total cycle length is given by,
Now increasing the pedestrian volume with
Table 6
| New conflicting pedestrian volume | 1138 | 1517 | 1517 | 1138 |
According to the new pedestrian volume calculating minimum time required by pedestrian for each approach:
Calculating
Calculating new minimum time required (
Minimum time required for N approach (
Minimum time required for S approach (
Minimum time required for E approach (
Minimum time required for W approach (
Comparing the
Selecting greater values in between both
Table 7
| Phase | New minimum green time (in sec) |
Sum of green and yellow time is given by,
Total new cycle length is given by,
Conclusion:
With using pedestrian volume flow rate
Want to see more full solutions like this?
Chapter 8 Solutions
EBK TRAFFIC AND HIGHWAY ENGINEERING

- Compute the peak hour factor if the hourly volume of traffic is 1800 vehicles/hour and the highest 20-min. volume is 800.arrow_forwardDo you agree that a traffic intensity of greater than 0.8 indicates congestion? Explain your answer.arrow_forwardCars have a long queue at a stop sign. If the total time delay queueing is one min., compute the traffic intensity if the service rate of the road is only 360 veh/ hr. Assume both arrival and departure rates are exponentially distributed.arrow_forward
- The number of vehicles that can enter the on-ramp of Subic-Clark Expressway is controlled by a metering system. If the vehicles can enter the expressway at a rate of 500 veh/hr, and the rate of arrival of the vehicles at the on-ramp is 400 veh/hr during the peak hour. Determine the expected number of units waiting to be served in the system.arrow_forwardSubject: transportation engineering Read the question carefully and give me right solution according to the question. A signal has four phases, where the critical lane group flow ratios are 0.115, 0.204, 0.099, and 0.248. If the lost time per phase is 6 seconds and the critical intersection v/c ratio is 0.88, calculate the minimum cycle length and the phase effective green times such that the lane group v/c ratios are equal.arrow_forwardYou are designing a freeway as a passenger-car-only facility, and with ideal roadway characteristics. It is estimated that the freeway will have a traffic demand of 75,000 vehicles per day, a peak-hour factor of 0.88, and a directional distribution of 0.65. day. It is estimated that the freeway will have a free flow speed of 70mi/h. Determine the number of lanes (both directions) required to provide at least LOS D using the 60th highest annual hourly volume. Use k =0.11.arrow_forward
- Vehicles arrive at an entrance to a recreational park. There is a single gate (at which all vehicles must stop), where a park attendant distributes free brochures. The park opens at 8:00 AM. At which vehicles begin to arrive at a rate of 480 veh/h. After 20 minutes, the arrival flow rate declines to 120 veh/h and corrtinues at that level for the remainder of the day. If the time required to distribute the brochure is 15 seconds, and assuming D/D/1 queuing (a) draw the queuing diagram (b) describe the operational characteristics of the queue (maximum queue length, maximum queuing time, average queuing time per vehicle etc.)arrow_forward2. A public administration holds its flag ceremonies every Monday from 07:00 am –07:15 am. During the singing of National Anthem –which lasts for 2 minutes –all drivers stop in front of the building as a sign of respect. a.Determine the maximum length of queue formed. b.Estimate the time required for the traffic flow to be back to normal.arrow_forwardTraffic data are collected between Point X and Y. Seven vehicles pass in Point X at intervals of 18, 17, 19, 28, 25, 22, and 24 sec respectively. The vehicle's speeds are 60, 50, 55, 58, 52, 49, and 30 kph respectively. Calculate the flow, density, time mean speed, and space mean speed. Determine also the length of the segment.arrow_forward
- The traffic intensity of a certain freeway is 0.833. The arrival rate of vehicles at a certain intersection (stop sign) is 200 vehicles per hour. Compute the service rate in vehicles/hr. *arrow_forwardObservation post reveals that 8 vehicles passed through at intervals of 4.6 s, 6.23 s, 5.9 s, 7.1 s, 4.9 s, 3.8 s, 12.6 s, and 13.0 s, respectively. If the total distance travelled by the vehicles is 200 meters, i. If the density of traffic is 20 vpk, compute the rate of flow of traffic in vph. ii. If the speed limit imposed along the roadway is 100 kph, determine the percentage of speed limit violators.arrow_forwardThe rate of arrival of vehicles at the expressway can be considered to be Poisson with a mean of 45 veh/hr, and the rate of service to vehicles can be assumed to be exponentially distributed with a mean of 1 min. (a) What is the average number of vehicles waiting to be served at the booth (that is, the number of vehicles in queue, not including the vehicle being served)? (b) What is the length of the ramp required to provide storage for all exiting vehicles 90% of the time? Assume the average length of a vehicle is 18 ft and that there is an average space of 10 ft between consecutive vehicles waiting to be served. (c) What is the average waiting time a driver waits before being served at the tollbooth (that is, the average waiting time in the queue)?arrow_forward
 Traffic and Highway EngineeringCivil EngineeringISBN:9781305156241Author:Garber, Nicholas J.Publisher:Cengage Learning