
Concept explainers
Videos
Wobble, a start-up company, is developing a search engine for the Web. Given a particular search word, say Angelface (the name of a rock band), Wobbles strategy is to find all the Web sites containing the term Angelface, and then look at Web sites to which those Web sites link, to obtain a ranked list of search results. In other words, if there are lots of links pointing to Web site X from Web sites that mention Angelface, then it is likely that X contains lots of useful information about Angelface. In the digraph shown in Fig. 8-31, the vertices represent Web pages that contain the word Angelface and the arcs represent hyperlinks from one Web site to another.
a. Which Web sites would show up first, second, and third in the search results? Explain your answer.
b. One of the vertices of the digraph is the official Angelface Web site. Which do you think it is? Explain your answer.
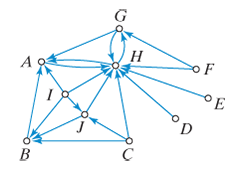
Figure 8-31
Want to see the full answer?
Check out a sample textbook solution
Chapter 8 Solutions
Excursions in Modern Mathematics


- Suppose a veterinarian wants to estimate the difference between the proportion of cat owners who are single and the proportion of dog owners who are single. Of the pet owners that visit any of the veterinarian clinics in her city regularly, she identifies 3872 pet owners that exclusively have cats and 4108 pet owners that exclusively have dogs. From this list of pet owners, she surveys 158 randomly selected cat owners and 139 randomly selected dog owners and asks each of them if they are single or married. Her findings are summarized in the table. Population Populationdescription Samplesize Number of successes Sampleproportion 1 cat owners ?1=158 ?1=63 ?̂1=0.39873 2 dog owners ?2=139 ?2=52 ?̂2=0.37410 Calculate the upper and lower limits (bounds) for a large sample 90% ?‑confidence interval for the difference in two population proportions, ?1−?2. Give each of your answers with three decimal places of precision.arrow_forwardIn 2018, a consumer goods giant had more than 20 brands with more than $1 billion in annual sales. How does the company create so many successful consumer products? They effectively invests in research and development to understand what consumers want. One method used to determine consumer preferences is called conjoint analysis. Conjoint analysis allows a company to ascertain the utility that a respondent in the conjoint study places on a design of a given product. The higher the utility, the more valuable a respondent finds the design. Suppose we have conducted a conjoint study and have the following estimated utilities (higher is preferred) for each of three different designs for a new whitening toothpaste. Respondent Utilities Design A Design B Design C 1 24.6 34.4 28.8 2 31.4 31.4 33.9 3 31.8 20.2 27.8 4 15.4 26.4 25.1 5 20.7 18.3 18.2 6 41.0 34.0 44.8 7 27.1 22.5 27.3 8 20.2 21.8 27.9 9 31.6 29.4 31.3 10 24.4 29.0 29.3 At the 0.05 level of…arrow_forwardSuppose that there are 43 candidates, 32 men and 11 women, who apply for the Graduate Hiring Program at PricewaterhouseCoopers. Eight of these candidates must be randomly chosen for interviews from the pool of 32 men and 11 women. If X counts the number of women chosen, then X followsarrow_forward
- Find the number of ways of selecting exactly one of the two best applicants in a selection of two out of fivearrow_forwardThe television show Lett3rs has been successful for many years. That show recently had a share of 19, which means, that among the TV sets in use, 19% were tuned to Lett3rs. An advertiser wants to verify that 19% share value by conducting its own survey, and a pilot survey begins with 10 households have TV sets in use at the time of a Lett3rs broadcast. If at most one household is tuned to Lett3rs, does it appear that the 19% share value is wrong? (Hint: Is the occurrence of at most one household tuned to Lett3rs unusual?) A. no, it is not wrongB. yes, it is wrongarrow_forwardIn the provided table, the education information and incomes of 73,736 people are given. The rows are labeled with education status and the columns are labeled with income range. The total of all entries in each row gives the total number of people with the corresponding education status and similarly, the total of all entries of a particular column gives the number of people with the corresponding income range. Please answer subpart 4 and 5.arrow_forward
- A music professor offers his 40 students the option of coming to an additional rehearsal session theweek before their juries (musical final exams.) In order to decide whether these extra sessions actuallyhelp students, he keeps track of who attends them and compares their jury scores to those of students who did not schedule extra sessions. In this study, a difference was found between the scores of students who scheduled the extra sessions and those of students who didn't attend(higher average for students with extra sessions) A) Yes, becuase the study relied on a common final exam fro everyone B)No, because the students chose whether they attended the review session or not C) Yes becuase the study included both students who attned the review session and those who did not D)Yes, becuase the number of subjects in the study was large E)No, becuase the students in the study were not blindedarrow_forwardIn a survey of 120 people, it was found that: 65 read Newsweek magazine, 20 read both Newsweek and Time, 45 read Time, 25 read both Newsweek and Fortune, 42 read Fortune, 15 read both Time and Fortune, 8 read all three magazines. Find the number of people who read exactly one magazine.arrow_forwardShow that in a group of people there must be two individuals that have the same number of friends within the group.arrow_forward
- In a random sample of 1500 voters from the state of New York, 670 identified themselves as Democrats, 580 identified themselves as Republicans, and 250 identified themselves as Independents. Of the Democrats, 495 stated that they disapprove of the current president. The similar numbers for the Republicans and the Independents are 265 and 145, respectively. Let p1 be the proportion of all Democrat and Independent voters in New York who disapprove of the current president, and define p2 similarly for the Republicans. The endpoints of a 95% confidence interval for p1-p2 are closest to which of the following? a. 0.188 to 0.289 b. 0.197 to 0.281 c. 0.235 to 0.329 d. 0.050 to 0.196arrow_forwardThere are 10 males and 18 females in the Data Management class. How many different committees of 5 students can be formed if there must be at least 2 males?arrow_forwardThe figure to the right shows the results of a survey in which 1012 adults from Country A, 1009 adults from Country B, 1016 adults from Country C, 1010 adults from Country D, and 1005 adults from Country E were asked whether national identity is strongly tied to birthplace. A table labeled "National Identity and Birthplace, People from different countries who believe national identity is strongly tied to birthplace" consists of five rows containing the following information from top to bottom, with row listed first and information listed second: Country A, 31 percent; Country B, 20 percent; Country C, 25 percent; Country D, 53 percent; Country E, 12 percent.Country A31%20%25%53%Country BCountry CCountry DCountry E12% Construct a 99% confidence interval for the population proportion of adults who say national identity is strongly tied to birthplace for each country listed.arrow_forward
 Discrete Mathematics and Its Applications ( 8th I...MathISBN:9781259676512Author:Kenneth H RosenPublisher:McGraw-Hill Education
 Mathematics for Elementary Teachers with Activiti...MathISBN:9780134392790Author:Beckmann, SybillaPublisher:PEARSON
 Thinking Mathematically (7th Edition)MathISBN:9780134683713Author:Robert F. BlitzerPublisher:PEARSON
 Discrete Mathematics With ApplicationsMathISBN:9781337694193Author:EPP, Susanna S.Publisher:Cengage Learning,
 Pathways To Math Literacy (looseleaf)MathISBN:9781259985607Author:David Sobecki Professor, Brian A. MercerPublisher:McGraw-Hill Education