
Videos
a.
Give all the possible samples of size 2.
Find the mean of every sample.
a.
Answer to Problem 21CE
All possible samples of size 2 are
The mean of every sample is 1, 1.5, 2, 1.5, 2, 2.5, 2, 2.5 and 3.
Explanation of Solution
The mean is calculated by using the following formula:
| Sample | Mean |
Thus, all possible samples of size 2 are
Thus, the mean of every sample is 1, 1.5, 2, 1.5, 2, 2.5, 2, 2.5 and 3.
b.
Compute the means of the distribution of the sample mean and the population mean.
Give the comparison of the mean of the distribution of the sample mean with the population mean.
b.
Answer to Problem 21CE
The means of the distribution of the sample mean and the population mean are 2 and 2.
The mean of the distribution of the sample means is equal to the population mean.
Explanation of Solution
Population mean is calculated as follows:
Then, the population mean is 2.
The mean of the sample means is calculated as follows:
Then, mean of the distribution of the sample mean is 2.
Thus, the means of the distribution of the sample mean and the population mean are 2 and 2.
Comparison:
The mean of the distribution of the sample mean is 2 and the population mean is 2. The two means are exactly same.
Thus, the mean of the distribution of the sample means is equal to the population mean.
c.
Give the dispersion of the population with that of the sample mean.
c.
Answer to Problem 21CE
The dispersion in the population is two times greater than that of the sample mean.
Explanation of Solution
The variance of the population is
The variance of the sample means is
Thus, the dispersion in the population is two times greater than that of the sample mean.
d.
Give the shapes of the two distributions.
d.
Answer to Problem 21CE
The shape of the population distribution is Uniform.
The shape of the distribution of the sample means is triangular.
Explanation of Solution
The frequency distribution of the population is:
| Values | Frequency | Probability |
| 1 | 1 | |
| 2 | 1 | |
| 3 | 1 | |
Software procedure:
Step-by-step procedure to obtain the bar chart using MINITAB:
- Choose Stat > Graph > Bar chart.
- Under Bars represent, enter select Values from a table.
- Under One column of values select Simple.
- Click on OK.
- Under Graph variables enter probability and under categorical variable enter Values.
- Click OK.
Output using MINITAB software is given below:
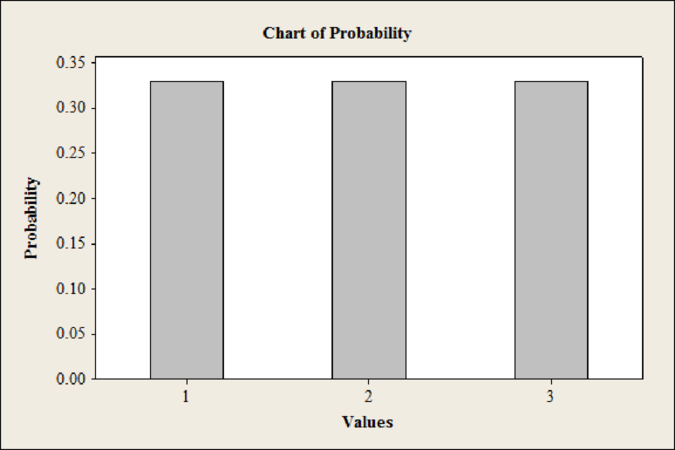
From the MINITAB output, it can be observed that the shape of the population distribution is uniform.
Thus, the shape of the population distribution is Uniform.
The frequency distribution of the sample means is:
| Sample mean | Frequency | Probability |
| 1 | 1 | |
| 1.5 | 2 | |
| 2 | 3 | |
| 2.5 | 2 | |
| 3 | 1 | |
Software procedure:
Step-by-step procedure to obtain the bar chart using MINITAB:
- Choose Stat > Graph > Bar chart.
- Under Bars represent, enter select Values from a table.
- Under One column of values select Simple.
- Click on OK.
- Under Graph variables enter probability and under categorical variable enter Sample mean.
- Click OK.
Output using MINITAB software is given below:
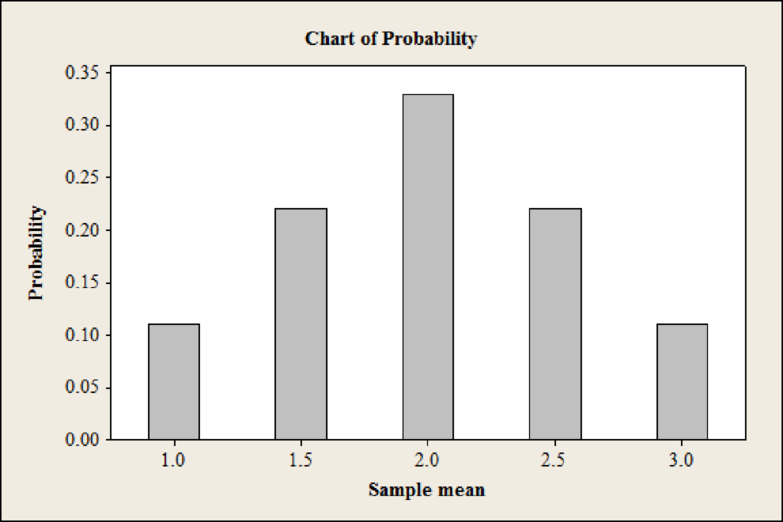
From the MINITAB output, it can be observed that the shape of the distribution of the sample means is triangular.
Thus, the shape of the distribution of the sample means is triangular.
Want to see more full solutions like this?
Chapter 8 Solutions
Statistical Techniques in Business and Economics, 16th Edition


 Glencoe Algebra 1, Student Edition, 9780079039897...AlgebraISBN:9780079039897Author:CarterPublisher:McGraw Hill