
Concept explainers
Videos
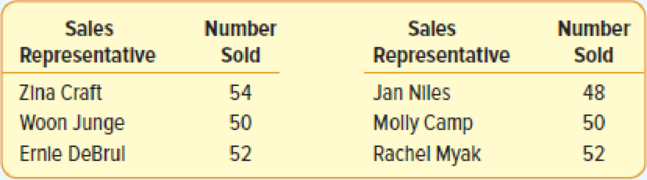
The Appliance Center has six sales representatives at its North Jacksonville outlet. The following table lists the number of refrigerators sold by each representative last month.
- a. How many samples of size 2 are possible?
- b. Select all possible samples of size 2 and compute the
mean number sold. - c. Organize the sample means into a frequency distribution.
- d. What is the mean of the population? What is the mean of the sample means?
- e. What is the shape of the population distribution?
- f. What is the shape of the distribution of the sample mean?
a.
Find the possible number of different samples of size 2.
Answer to Problem 30CE
The possible number of different samples of size 2 is 15.
Explanation of Solution
From the given information, there are six representatives.
The possible number of different samples of size two is obtained by using the following formula:
Substitute 6 for the N and 2 for the n.
Then,
Thus, the possible number of different samples of size 2 is 15.
b.
Give the all possible samples of size 2.
Find the mean of each sample.
Answer to Problem 30CE
All possible samples of size 2 are
The mean of each sample is 52, 53, 51, 52, 53, 51, 49, 50, 51, 50, 51, 52, 49, 50 and 51.
Explanation of Solution
The mean is calculated by using the following formula:
| Sample | Mean |
Thus, all possible samples of size 2 are
Thus, the mean of each sample is 52, 53, 51, 52, 53, 51, 49, 50, 51, 50, 51, 52, 49, 50 and 51.
c.
Create a frequency distribution for the sample means.
Answer to Problem 30CE
A frequency distribution for the sample means is
| Sample mean | Probability |
| 49 | |
| 50 | |
| 51 | |
| 52 | |
| 53 |
Explanation of Solution
A frequency distribution for the sample means is obtained as follows:
Let
| Sample mean | f | Probability |
| 49 | 2 | |
| 50 | 3 | |
| 51 | 5 | |
| 52 | 3 | |
| 53 | 2 | |
d.
Find the population mean.
Find the mean of the sample means.
Answer to Problem 30CE
The population mean is 51.
The mean of the distribution of the sample means is 51.
Explanation of Solution
Population mean is calculated as follows:
From the given information, the number of refrigerators sold by each representative is 54, 50, 52, 48, 50 and 52.
The mean of the sample means is calculated as follows:
Comparison:
The mean of the distribution of the sample mean is 51 and the population mean is 51. The two means are exactly same.
Thus, the mean of the distribution of the sample means is equal to the population mean.
e.
Find the shape of the population distribution.
Answer to Problem 30CE
The shape of the population distribution is normal.
Explanation of Solution
A frequency distribution for the number sold is obtained as follows:
| Number sold | f | Probability |
| 48 | 1 | |
| 50 | 2 | |
| 52 | 2 | |
| 54 | 1 | |
Step-by-step procedure to obtain the bar chart using MINITAB:
- Choose Stat > Graph > Bar chart.
- Under Bars represent, enter select Values from a table.
- Under One column of values select Simple.
- Click on OK.
- Under Graph variables enter probability and under categorical variable enter Number sold.
- Click OK.
Output using MINITAB software is given below:
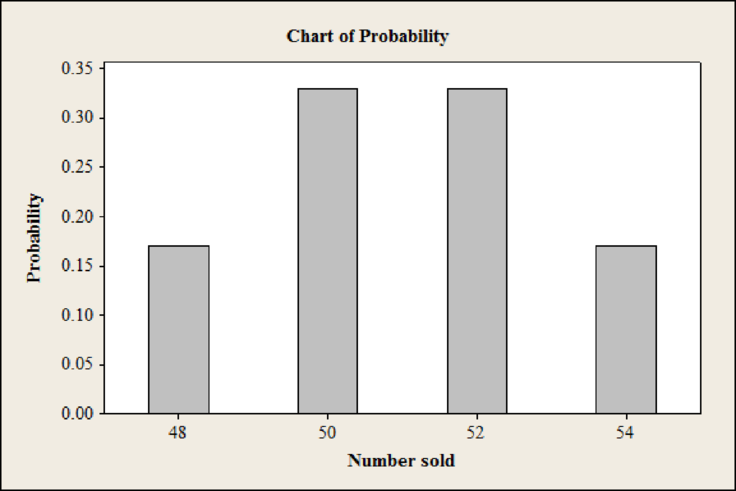
From the bar chart it can be observed that the shape of the population distribution is normal.
f.
Find the shape of the distribution of the sample mean.
Answer to Problem 30CE
The shape of the distribution of the sample means is normal.
Explanation of Solution
Step-by-step procedure to obtain the bar chart using MINITAB:
- Choose Stat > Graph > Bar chart.
- Under Bars represent, enter select Values from a table.
- Under One column of values select Simple.
- Click on OK.
- Under Graph variables enter probability and under categorical variable enter sample mean.
- Click OK.
Output using MINITAB software is given below:
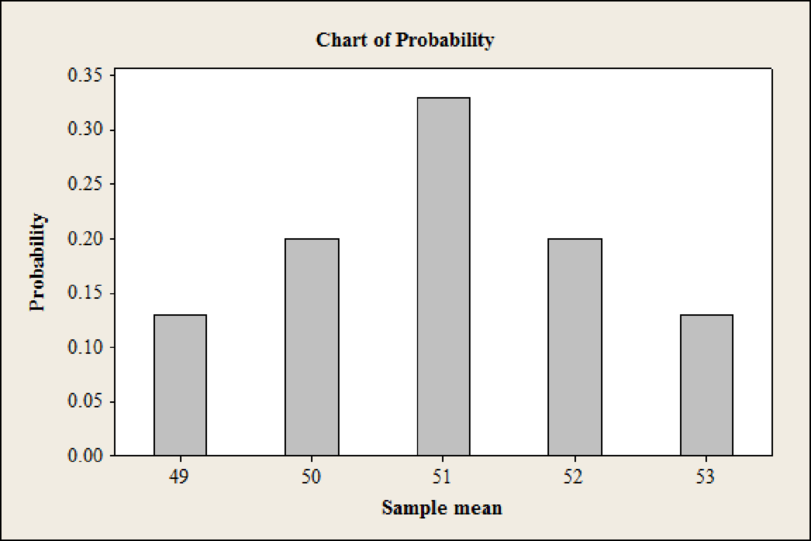
From the bar chart it can be observed that the shape of the distribution of the sample means is normal.
Thus, the shape of the distribution of the sample means is normal.
Want to see more full solutions like this?
Chapter 8 Solutions
Statistical Techniques in Business and Economics, 16th Edition


 Glencoe Algebra 1, Student Edition, 9780079039897...AlgebraISBN:9780079039897Author:CarterPublisher:McGraw Hill