
Concept explainers
Videos
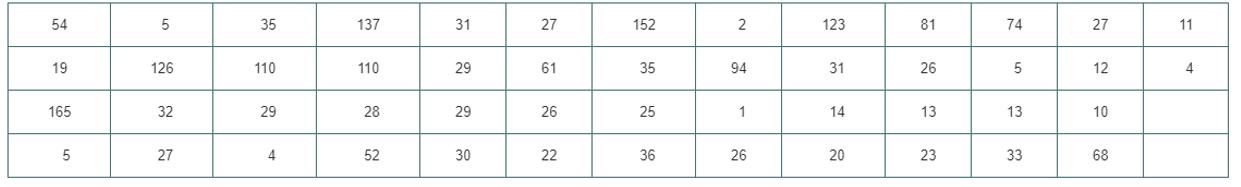
One of the major measures of the quality of service provided by any organization is the speed with which the organization responds to customer complaints. A large family-held department store selling furniture and flooring, including carpet, had undergone a major expansion in the past several years. In particular, the flooring department had expanded from 2 installation crews to an installation supervisor, a measurer, and 15 installation crews. The store had the business objective of improving its response to complaints. The variable of interest was defined as the number of days between when the complaint was made and when it was resolved. Data were collected from 50 complaints that were made in the past year. The data, stored in Furniture, are as follows:
a. Construct a 95% confidence
b. What assumption must you make about the population distribution in order to construct the confidence interval estimate in (a)?
c. Do you think that the assumption needed in order to construct the confidence interval estimate in (a) is valid? Explain.
d. What effect might your conclusion in (c) have on the validity of the results in (a)?
Want to see the full answer?
Check out a sample textbook solution
Chapter 8 Solutions
Basic Business Statistics


- One of the major measures of the quality of service provided by an organization is the speed with which the organization responds to customer complaints. A large family-held department store selling furniture and flooring, including carpet, had undergone a major expansion in the past several years. In particular, the flooring department had expanded from 2 installation crews to an installation supervisor, a measurer, and 15 installation crews. A business objective of the company was to reduce the time between when the complaint is received and when it is resolved. During a recent year, the company received 50 complaints concerning carpet installation. The data from the 50 complaints, represent the number of days between the receipt of the complaint and the resolution of the complaint: 54 5 35 137 31 27 152 2 123 81 74 27 11 19 126 110 110 29 61 35 94 31 26 5 12 4 165 32 29 28 29 26 25 1 14 13 13 10 5 27 4 52 30 22 36 26 20 23 33 68 Construct a frequency distribution and a percentage…arrow_forwardOne of the major measures of the quality of service provided by an organization is the speed with which the organization responds to customer complaints. A large family-held department store selling furniture and flooring, including carpet, had undergone a major expansion in the past several years. In particular, the flooring department had expanded from 2 installation crews to an installation supervisor, a measurer, and 15 installation crews. A business objective of the company was to reduce the time between when the complaint is received and when it is resolved. During a recent year, the company received 50 complaints concerning carpet installation. The data from the 50 complaints, represent the number of days between the receipt of the complaint and the resolution of the complaint: 54 5 35 137 31 27 152 2 123 81 74 27 11 19 126 110 110 29 61 35 94 31 26 5 12 4 165 32 29 28 29 26 25 1 14 13 13 10 5 27 4 52 30 22 36 26 20 23 33 68 Construct a histogram and a percentage polygon.arrow_forwardOne of the major measures of the quality of service provided by an organization is the speed with which the organization responds to customer complaints. A large family-held department store selling furniture and flooring, including carpet, had undergone a major expansion in the past several years. In particular, the flooring department had expanded from 2 installation crews to an installation supervisor, a measurer, and 15 installation crews. A business objective of the company was to reduce the time between when the complaint is received and when it is resolved. During a recent year, the company received 50 complaints concerning carpet installation. The data from the 50 complaints, represent the number of days between the receipt of the complaint and the resolution of the complaint: 54 5 35 137 31 27 152 2 123 81 74 27 11 19 126 110 110 29 61 35 94 31 26 5 12 4 165 32 29 28 29 26 25 1 14 13 13 10 5 27 4 52 30 22 36 26 20 23 33 68 Construct a cumulative percentage distribution and…arrow_forward
- The Conch Café, located in Gulf Shores, Alabama, features casual lunches with a great view of the Gulf of Mexico. To accommodate the increase in business during the summer vacation season, Fuzzy Conch, the owner, hires a large number of servers as seasonal help. When he interviews a prospective server, he would like to provide data on the amount a server can earn in tips. He believes that the amount of the bill and the number of diners are both related to the amount of the tip. He gathered the following sample information. Customer Amount of Tip Amount of Bill Number of Diners Customer Amount of Tip Amount of Bill Number of Diners 1 $ 7.00 $ 48.97 5 16 $ 3.30 $ 23.59 2 2 4.50 28.23 4 17 3.50 22.30 2 3 1.00 10.65 1 18 3.25 32.00 2 4 2.40 19.82 3 19 5.40 50.02 4 5 5.00 28.62 3 20 2.25 17.60 3 6 4.25 24.83 2 21 5.50 44.47 4 7 0.50 6.24 1 22 3.00 20.27 2…arrow_forwardThe Conch Café, located in Gulf Shores, Alabama, features casual lunches with a great view of the Gulf of Mexico. To accommodate the increase in business during the summer vacation season, Fuzzy Conch, the owner, hires a large number of servers as seasonal help. When he interviews a prospective server, he would like to provide data on the amount a server can earn in tips. He believes that the amount of the bill and the number of diners are both related to the amount of the tip. He gathered the following sample information. Customer Amount of Tip Amount of Bill Number of Diners Customer Amount of Tip Amount of Bill Number of Diners 1 $ 6.05 $ 73.22 1 16 $ 3.30 $ 23.59 2 2 4.50 28.23 4 17 3.50 22.30 2 3 1.00 10.65 1 18 3.25 32.00 2 4 2.40 19.82 3 19 5.40 50.02 4 5 5.00 28.62 3 20 2.25 17.60 3 6 4.25 24.83 2 21 1.40 41.80 5 7 .50 6.25 1 22 3.00 20.27 2…arrow_forwardFor each problem, select the best response. (a) Does mandatory gun ownership prevent crime? To study this, the number of burglaries committed each month in a small town were recorded for 75 months prior to passage of a bill requiring citizens to own guns and for 56 months after passage of the bill. The goal was to see if the number of burglaries committed was affected by requiring citizens to own guns. The response variable here is A. whether or not gun ownership is required by law. B. the number of burglaries committed. C. the number of guns owned. D. whether or not a burglary was committed by a gun owner. E. None of the above. (b) Can one predict a student's score on the midterm exam in a statistics course from the number of hours the student spent studying for the exam? To explore this, the teacher of the course asks students how many hours they spent studying for the exam and then makes a scatterplot of the time students spent studying and their scores on the exam. In…arrow_forward
- A manufacturing company is analyzing its accident record. The accidents fall into two categories: Minor—dealt with by first aider: Average cost k50 Major—hospital required. Average cost k1,000 The company has 1,000 employees, of which 180 are office staff and the rest work in the factory. The analysis shows that 10% of employees have an accident each year and 20% of accidents are major. It is assumed that an employee has more than one accident in a year. (i) Determine the expected total cost of accidents in a year. [] On further analysis it is discovered that a member of office staff has half the probability of having an accident relative those in the factory. (ii) Show that the probability that a given a member of office staff has an accident in a year is 0.0549. (iii) Determine the probability that a randomly chosen employee who has had an accident is office staff.arrow_forwardompanies in the U.S. car rental market vary greatly in terms of the size of the fleet, the number of locations, and annual revenue. In 2011, Hertz had 320,000 cars in service and annual revenue of approximately $4.2 billion. Suppose the following data show the number of cars in service (1,000s) and the annual revenue ($ millions) for six smaller car rental companies. Company Cars(1,000s) Revenue($ millions) Company A 11.5 120 Company B 10.0 133 Company C 9.0 98 Company D 5.5 37 Company E 4.2 38 Company F 3.3 30 (a) Develop a scatter diagram with the number of cars in service as the independent variable. A scatter diagram has 6 points plotted on it. The horizontal axis ranges from 0 to 14 and is labeled: Cars in Service (1,000s). The vertical axis ranges from 0 to 160 and is labeled: Annual Revenue ($ millions). The points are plotted from left to right in an upward, diagonal direction starting from the lower left corner of the diagram and are between 3 to 12 on…arrow_forwardQualitative variables can be divided into two types:arrow_forward
- A manufacturing company is analyzing its accident record. The accidents fall into two categories: Minor—dealt with by first aider: Average cost k50 Major—hospital required. Average cost k1,000The company has 1,000 employees, of which 180 are office staff and the rest work in the factory.The analysis shows that 10% of employees have an accident each year and 20% of accidents are major. It is assumed that an employee has more than one accident in a year.(i) Determine the expected total cost of accidents in a year. On further analysis it is discovered that a member of office staff has half the probability of having an accident relative those in the factory. (ii)Show that the probability that a given a member of office staff has an accident in a year is 0.0549.(iii) Determine the probability that a randomly chosen employee who has had an accident is office staff.arrow_forwardCompanies in the U.S. car rental market vary greatly in terms of the size of the fleet, the number of locations, and annual revenue. In 2011, Hertz had 320,000 cars in service and annual revenue of approximately $4.2 billion. Suppose the following data show the number of cars in service (1,000s) and the annual revenue ($ millions) for six smaller car rental companies. Company Cars (1,000s) Revenue ($ millions) Company A 11.5 116 Company B 10 137 Company C 9 102 Company D 5.5 39 Company E 4.2 38 Company F 3.3 30 (a) Develop a scatter diagram with the number of cars in service as the independent variable. (b) What does the scatter diagram developed in part (a) indicate about the relationship between the two variables? (c) Use the least squares method to develop the estimated regression equation that can be used to predict annual revenue (in $ millions) given the number of cars in service (in 1,000s). (Round your numerical values to three decimal…arrow_forwardCompanies in the U.S. car rental market vary greatly in terms of the size of the fleet, the number of locations, and annual revenue. In 2011, Hertz had 320,000 cars in service and annual revenue of approximately $4.2 billion. Suppose the following data show the number of cars in service (1,000s) and the annual revenue ($ millions) for six smaller car rental companies. Company Cars(1,000s) Revenue($ millions) Company A 11.5 116 Company B 10.0 133 Company C 9.0 98 Company D 5.5 37 Company E 4.2 40 Company F 3.3 32 a.Use the least squares method to develop the estimated regression equation that can be used to predict annual revenue (in $ millions) given the number of cars in service (in 1,000s). (Round your numerical values to three decimal places.) b. For every additional car placed in service, estimate how much annual revenue will change (in dollars). (Round your answer to the nearest integer.) Annual revenue will increase by $ , for every additional car placed in…arrow_forward
 Functions and Change: A Modeling Approach to Coll...AlgebraISBN:9781337111348Author:Bruce Crauder, Benny Evans, Alan NoellPublisher:Cengage Learning