
Videos
Select a random sample of 15 individuals and test one or more of the hypotheses in Exercise 1 by using the t test. Use α = 0.05.
The Data Bank is found in Appendix B, or on the World Wide Web by following links from www.mhhe.com/math/stats/bluman/
1. From the Data Bank, select a random sample of at least 30 individuals, and test one or more of the following hypotheses by using the z test. Use α = 0.05.
a. For serum cholesterol, H0: μ = 220 milligram percent (mg%). Use σ = 5.
b. For systolic pressure, H0: μ = 120 millimeters of mercury (mm Hg). Use σ = 13.
c. For IQ, H0: μ = 100. Use σ = 15.
d. For sodium level, H0: μ = 140 milliequivalents per liter (mEq/l). Use σ = 6.
a.
To test: The claim that
Answer to Problem 2DA
The conclusion is that there is sufficient evidence to infer that the average serum cholesterol level is 220 milligram percent (mg%).
Explanation of Solution
Answer will vary. One of the possible answers is given below:
Given info:
Claim:
Calculation:
State the null and alternative hypotheses:
Null hypothesis:
Alternative hypothesis:
Test statistic value and P-value:
Software procedure:
Step by step procedure to obtain the test value using the MINITAB software:
- Choose Stat > Basic Statistics > 1-Sample t.
- In Samples in Column, enter the column of Serum cholesterol.
- In Perform hypothesis test, enter the test mean as 220.
- Check Options; enter Confidence level as 95%.
- Choose not equal in alternative.
- Click OK in all dialogue boxes.
Output using the MINITAB software is given below:
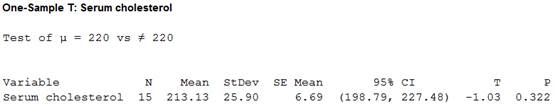
From the output, the test value is –1.03 and the P-value is 0.322.
Make the Decision:
Decision rule:
If
If
Here, the P-value is greater than the level of significance.
That is,
By the decision rule, the null hypothesis is not rejected.
Thus, the decision is “fail to reject the null hypothesis”.
Summarize the result:
There is sufficient evidence to infer that the average serum cholesterol level is 220 milligram percent (mg%).
b.
To test: The claim that
Answer to Problem 2DA
The conclusion is that there is sufficient evidence to infer that the average systolic pressure is differs from 120 millimeters of mercury (mm Hg).
Explanation of Solution
Given info:
Claim:
Calculation:
State the null and alternative hypotheses:
Null hypothesis:
Alternative hypothesis:
Test statistic value and P-value:
Software procedure:
Step by step procedure to obtain the test value using the MINITAB software:
- Choose Stat > Basic Statistics > 1-Sample t.
- In Samples in Column, enter the column of Systolic pressure.
- In Perform hypothesis test, enter the test mean as 120.
- Check Options; enter Confidence level as 95%.
- Choose not equal in alternative.
- Click OK in all dialogue boxes.
Output using the MINITAB software is given below:
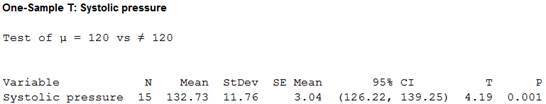
From the output, the test value is 4.19 and the P-value is 0.001.
Make the Decision:
Here, the P-value is lesser than the level of significance.
That is,
By the decision rule, the null hypothesis is rejected.
Thus, the decision is “reject the null hypothesis”.
Summarize the result:
There is sufficient evidence to infer that the average systolic pressure is differs from 120 millimetres of mercury (mm Hg).
c.
To test: The claim that
Answer to Problem 2DA
The conclusion is that there is sufficient evidence to infer that the average IQ score is differs from 100.
Explanation of Solution
Given info:
Claim:
Calculation:
State the null and alternative hypotheses:
Null hypothesis:
Alternative hypothesis:
Test statistic value and P-value:
Software procedure:
Step by step procedure to obtain the test value using the MINITAB software:
- Choose Stat > Basic Statistics > 1-Sample t.
- In Samples in Column, enter the column of IQ.
- In Perform hypothesis test, enter the test mean as 100.
- Check Options; enter Confidence level as 95%.
- Choose not equal in alternative.
- Click OK in all dialogue boxes.
Output using the MINITAB software is given below:
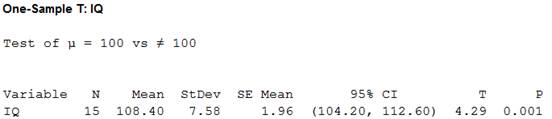
From the output, the test value is 4.29 and the P-value is 0.000.
Make the Decision:
Here, the P-value is lesser than the level of significance.
That is,
By the decision rule, the null hypothesis is rejected.
Thus, the decision is “reject the null hypothesis”.
Summarize the result:
There is sufficient evidence to infer that the average IQ score is differs from 100.
d.
To test: The claim that
Answer to Problem 2DA
The conclusion is that there is sufficient evidence to infer that the average sodium level is 140.
Explanation of Solution
Given info:
Claim:
Calculation:
State the null and alternative hypotheses:
Null hypothesis:
Alternative hypothesis:
Test statistic value and P-value:
Software procedure:
Step by step procedure to obtain the test value using the MINITAB software:
- Choose Stat > Basic Statistics > 1-Sample t.
- In Samples in Column, enter the column of Sodium level.
- In Perform hypothesis test, enter the test mean as 140.
- Check Options; enter Confidence level as 95%.
- Choose not equal in alternative.
- Click OK in all dialogue boxes.
Output using the MINITAB software is given below:
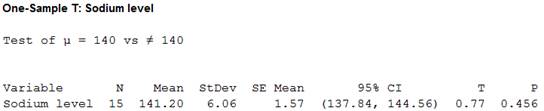
From the output, the test value is 0.77 and the P-value is 0.456.
Make the Decision:
Here, the P-value is greater than the level of significance.
That is,
By the decision rule, the null hypothesis is not rejected.
Thus, the decision is “fail to reject the null hypothesis”.
Summarize the result:
There is sufficient evidence to infer that the average sodium level is 140.
Want to see more full solutions like this?
Chapter 8 Solutions
ELEMENTARY STATISTICS


- A simple random sample of front-seat occupants involved in car crashes is obtained. Among 2795occupants not wearing seat belts, 36 were killed. Among 7682 occupants wearing seat belts, 15 were killed. Use a. 0.01significance level to test the claim that seat belts are effective in reducing fatalities. Complete parts (a) through (c) below. a. Test the claim using a hypothesis test. Consider the first sample to be the sample of occupants not wearing seat belts and the second sample to be the sample of occupants wearing seat belts. What are the null and alternative hypotheses for the hypothesis test? A. H0: p1=p2 H1: p1≠p2 B. H0: p1≥p2 H1: p1≠p2 C. H0: p1=p2 H1: p1<p2 D. H0: p1≠p2 H1: p1=p2 E. H0: p1≤p2 H1: p1≠p2 F. H0: p1=p2 H1: p1>p2 Identify the test statistic. z= ? (Round to two decimal places as needed.) Identify the P-value. P-value= ? (Round to three decimal…arrow_forwardA local pizza restaurant wants to investigate the possibility of starting to deliver pizzas. The store owner has determined that home delivery will be successful only if the average time spent on a delivery does not exceed 26 minutes. The owner has randomly selected 19 customers and delivered pizzas to their homes. What hypothesis should the owner test to show that the pizza delivery will not be successful?arrow_forwardLisa wants to determine if graduates from her collegeearn different incomes than do graduates from college in general. To test this, Lisa surveys 1,000 graduates from her college and finds that the average income is $40,000 (s= 5,000). If the average income is $45,000 for graduates in general, do the incomes of the graduates from Lisa's college differ significantly? Use an alpha of .05 and a two-tailed test. Complete all 4 steps of hypothesis testing.arrow_forward
- For the given scenario, determine the type of error that was made, if any. (Hint: Begin by determining the null and alternative hypotheses.) A pharmaceutical company claims only 2% as the percentage of people taking a particular drug that experience significant side effects. One researcher claims that the percentage of people taking a particular drug that experience significant side effects is less than 2%. The researcher conducts a hypothesis test and fails to reject the null hypothesis. Assume that in reality, the percentage of people taking a particular drug that experience significant side effects is 0.5%. Was an error made? If so, what type?arrow_forwardAssume that a simple random sample has been selected from a normally distributed population and test the given claim. Identify the null and alternative hypotheses, test statistic, P-value, and state the final conclusion that addresses the original claim. A safety administration conducted crash tests of child booster seats for cars. Listed below are results from those tests, with the measurements given in hic (standard head injury condition units). The safety requirement is that the hic measurement should be less than 1000 hic. Use a 0.01 significance level to test the claim that the sample is from a population with a mean less than 1000 hic. Do the results suggest that all of the child booster seats meet the specified requirement? 613 579 1072 551 497 654 Identify the test statistic. Identify the P-value.arrow_forwardAssume that a simple random sample has been selected from a normally distributed population and test the given claim. Identify the null and alternative hypotheses, test statistic, P-value, and state the final conclusion that addresses the original claim. A safety administration conducted crash tests of child booster seats for cars. Listed below are results from those tests, with the measurements given in hic (standard head injury condition units). The safety requirement is that the hic measurement should be less than 1000 hic. Use a 0.05significance level to test the claim that the sample is from a population with a mean less than 1000 hic. Do the results suggest that all of the child booster seats meet the specified requirement? 711 679 1146 618 573 581 Identify the null and alternative hypotheses. What is the test statistic? What is the P-value? State the final conclusion that addresses the original claim.arrow_forward
- Assume that a simple random sample has been selected from a normally distributed population and test the given claim. Identify the null and alternative hypotheses, test statistic, P-value, and state the final conclusion that addresses the original claim. A safety administration conducted crash tests of child booster seats for cars. Listed below are results from those tests, with the measurements given in hic (standard head injury condition units). The safety requirement is that the hic measurement should be less than 1000 hic. Use a 0.05 significance level to test the claim that the sample is from a population with a mean less than 1000 hic. Do the results suggest that all of the child booster seats meet the specified requirement? 646 712 1193 620 546 477 What are the hypotheses? A. H0: μ=1000 hic H1: μ≥1000 hic B. H0: μ>1000 hic H1: μ<1000 hic C. H0: μ=1000 hic H1: μ<1000 hic D. H0: μ<1000…arrow_forwardAssume that a simple random sample has been selected from a normally distributed population and test the given claim. Identify the null and alternative hypotheses, test statistic, P-value, and state the final conclusion that addresses the original claim. A safety administration conducted crash tests of child booster seats for cars. Listed below are results from those tests, with the measurements given in hic (standard head injury condition units). The safety requirement is that the hic measurement should be less than 1000 hic. Use a 0.05 significance level to test the claim that the sample is from a population with a mean less than 1000 hic. Do the results suggest that all of the child booster seats meet the specified requirement? 722 715 1229 579 561 496 What are the hypotheses? A. Upper H 0 : mu equals1000 hic Upper H 1 : mu greater than or equals1000 hic B. Upper H 0 : mu greater…arrow_forwardAssume that a simple random sample has been selected from a normally distributed population and test the given claim. Identify the null and alternative hypotheses, test statistic, P-value, and state the final conclusion that addresses the original claim. A safety administration conducted crash tests of child booster seats for cars. Listed below are results from those tests, with the measurements given in hic (standard head injury condition units). The safety requirement is that the hic measurement should be less than 1000 hic. Use a 0.01 significance level to test the claim that the sample is from a population with a mean less than 1000 hic. Do the results suggest that all of the child booster seats meet the specified requirement? 747 747 1370 660 632 536 What are the hypotheses? A. H0: μ>1000 hic H1: μ<1000 hic B. H0: μ=1000 hic H1: μ<1000 hic C. H0: μ=1000 hic H1: μ≥1000 hic D. H0: μ<1000…arrow_forward
- Assume that a simple random sample has been selected from a normally distributed population and test the given claim. Identify the null and alternative hypotheses, test statistic, P-value, and state the final conclusion that addresses the original claim. A safety administration conducted crash tests of child booster seats for cars. Listed below are results from those tests, with the measurements given in hic (standard head injury condition units). The safety requirement is that the hic measurement should be less than 1000 hic. Use a 0.05 significance level to test the claim that the sample is from a population with a mean less than 1000 hic. Do the results suggest that all of the child booster seats meet the specified requirement? 669 662 1001 533 508 611 a) What are the hypotheses. b) Identify the test statistic. c) The P-value is. d) (reject/fail to reject). There is (sufficient/not sufficient) evidence to support the claim.arrow_forwardAssume that a simple random sample has been selected from a normally distributed population and test the given claim. Identify the null and alternative hypotheses, test statistic, P-value, and state the final conclusion that addresses the original claim. A safety administration conducted crash tests of child booster seats for cars. Listed below are results from those tests, with the measurements given in hic (standard head injury condition units). The safety requirement is that the hic measurement should be less than 1000 hic. Use a 0.05 significance level to test the claim that the sample is from a population with a mean less than 1000 hic. Do the results suggest that all of the child booster seats meet the specified requirement? a. Identify the test statistic. t equals. (Round to three decimal places as needed.) b. Identify the P-value. The P-value is. (Round to four decimal places as needed.)arrow_forwardAssume that a simple random sample has been selected from a normally distributed population and test the given claim. Identify the null and alternative hypotheses, test statistic, P-value, and state the final conclusion that addresses the original claim. A safety administration conducted crash tests of child booster seats for cars. Listed below are results from those tests, with the measurements given in hic (standard head injury condition units). The safety requirement is that the hic measurement should be less than 1000 hic. Use a 0.01 significance level to test the claim that the sample is from a population with a mean less than 1000 hic. Do the results suggest that all of the child booster seats meet the specified requirement? 673 683 1091 564 536 623 1. Identify the test statistic? T=? 2. What is the P-value? 3. What is the final conclusion?arrow_forward
 MATLAB: An Introduction with ApplicationsStatisticsISBN:9781119256830Author:Amos GilatPublisher:John Wiley & Sons Inc
 Probability and Statistics for Engineering and th...StatisticsISBN:9781305251809Author:Jay L. DevorePublisher:Cengage Learning
 Statistics for The Behavioral Sciences (MindTap C...StatisticsISBN:9781305504912Author:Frederick J Gravetter, Larry B. WallnauPublisher:Cengage Learning
 Elementary Statistics: Picturing the World (7th E...StatisticsISBN:9780134683416Author:Ron Larson, Betsy FarberPublisher:PEARSON
 The Basic Practice of StatisticsStatisticsISBN:9781319042578Author:David S. Moore, William I. Notz, Michael A. FlignerPublisher:W. H. Freeman
 Introduction to the Practice of StatisticsStatisticsISBN:9781319013387Author:David S. Moore, George P. McCabe, Bruce A. CraigPublisher:W. H. Freeman