
The question requires us to draw a graph representing an effective
Explanation of Solution
A price ceiling less than the
The following graph represents the correctly labeled diagram with a price ceiling and its impact on the market:
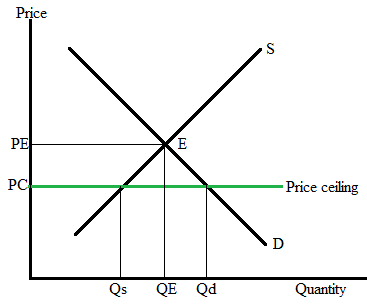
Initially, the economy runs at point E where,
Equilibrium price = PE
When the government sets a price ceiling, the price of the product falls to PC, and at this lower price,
Quantity demanded in the market = Qd
Quantity supplied in the market = Qs
Since the quantity demanded exceeds the quantity supplied there is a shortage of product in the market.
Size of shortage = Qd − Qs.
The shortage of housing in the market represents the inefficiency due to a price ceiling in the economy.
A price ceiling is a method used by the government to set the price of a product or service in the market. Purchasing or selling that product below that price would be a punishable act. The government usually sets the price ceiling below the equilibrium price to safeguard the interest of some consumers.
Chapter 8 Solutions
Krugman's Economics For The Ap® Course


 Principles of Economics (12th Edition)EconomicsISBN:9780134078779Author:Karl E. Case, Ray C. Fair, Sharon E. OsterPublisher:PEARSON
 Engineering Economy (17th Edition)EconomicsISBN:9780134870069Author:William G. Sullivan, Elin M. Wicks, C. Patrick KoellingPublisher:PEARSON
 Principles of Economics (MindTap Course List)EconomicsISBN:9781305585126Author:N. Gregory MankiwPublisher:Cengage Learning
 Managerial Economics: A Problem Solving ApproachEconomicsISBN:9781337106665Author:Luke M. Froeb, Brian T. McCann, Michael R. Ward, Mike ShorPublisher:Cengage Learning
 Managerial Economics & Business Strategy (Mcgraw-...EconomicsISBN:9781259290619Author:Michael Baye, Jeff PrincePublisher:McGraw-Hill Education