
The standard score for each of the score by SPSS and manually given in the data set.
Answer to Problem 7TP
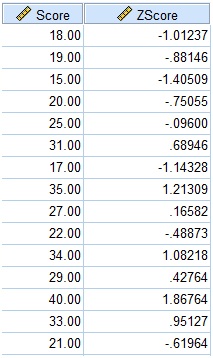
Fig (1)
The Z score for each scores obtained manual is shown in table below.
| Z score | |||
| 18 | 59.8044 | ||
| 19 | 45.3378 | ||
| 15 | 115.204 | ||
| 20 | 32.8711 | ||
| 25 | 0.53778 | ||
| 31 | 5.26667 | 27.7378 | |
| 17 | 76.2711 | ||
| 35 | 9.26667 | 85.8711 | |
| 27 | 1.26667 | 1.60444 | |
| 22 | 13.9378 | ||
| 34 | 8.26667 | 68.3378 | |
| 29 | 3.26667 | 10.6711 | |
| 40 | 14.2667 | 203.538 | |
| 33 | 7.26667 | 52.8044 | |
| 21 | 22.4044 | ||
| Total | 816.933 |
Fig (2)
The above both tables show same Z scores for each of the score.
Explanation of Solution
Given info:
The data set is given as follows:
| Score |
| 18 |
| 19 |
| 15 |
| 20 |
| 25 |
| 31 |
| 17 |
| 35 |
| 27 |
| 22 |
| 34 |
| 29 |
| 40 |
| 33 |
| 21 |
Calculation:
A z-score is the quantity of standard deviations from the mean an information point is. In any case, more in fact it's a measure of what numbers of standard deviations underneath or over the populace mean a crude score is. A z-score is otherwise called a standard score.
Step by step procedure to obtain the Z score using SPSS software is given below:
Steps for calculating Z score in SPSS:
- Go to Variable View, in first row write Score and come back to Data View.
- Click Analyze
Descriptive Statistics - Double click on the variable score to move it to the variables
- Click ok.
- The output will be as shown below.
Output using the SPSS software is given below:
Fig (1)
The above table shows the Z score corresponding to the each score.
The formula to calculate Z score is,
Mean:
The formula to calculate mean is,
Substitute 386 for
The formula to calculate sample standard deviation is,
Substitute 816.933 for
Use sample standard deviation for calculating of Z score and make a table of values.
| Z score | |||
| 18 | 59.8044 | ||
| 19 | 45.3378 | ||
| 15 | 115.204 | ||
| 20 | 32.8711 | ||
| 25 | 0.53778 | ||
| 31 | 5.26667 | 27.7378 | |
| 17 | 76.2711 | ||
| 35 | 9.26667 | 85.8711 | |
| 27 | 1.26667 | 1.60444 | |
| 22 | 13.9378 | ||
| 34 | 8.26667 | 68.3378 | |
| 29 | 3.26667 | 10.6711 | |
| 40 | 14.2667 | 203.538 | |
| 33 | 7.26667 | 52.8044 | |
| 21 | 22.4044 | ||
| Total | 816.933 |
Fig (1)
There is no difference of Z score whether Z score calculated by SPSS and manually.
Want to see more full solutions like this?
Chapter 8 Solutions
Study Guide To Accompany Neil J. Salkind's Statistics For People Who (think They) Hate Statistics

 MATLAB: An Introduction with ApplicationsStatisticsISBN:9781119256830Author:Amos GilatPublisher:John Wiley & Sons Inc
 Probability and Statistics for Engineering and th...StatisticsISBN:9781305251809Author:Jay L. DevorePublisher:Cengage Learning
 Statistics for The Behavioral Sciences (MindTap C...StatisticsISBN:9781305504912Author:Frederick J Gravetter, Larry B. WallnauPublisher:Cengage Learning
 Elementary Statistics: Picturing the World (7th E...StatisticsISBN:9780134683416Author:Ron Larson, Betsy FarberPublisher:PEARSON
 The Basic Practice of StatisticsStatisticsISBN:9781319042578Author:David S. Moore, William I. Notz, Michael A. FlignerPublisher:W. H. Freeman
 Introduction to the Practice of StatisticsStatisticsISBN:9781319013387Author:David S. Moore, George P. McCabe, Bruce A. CraigPublisher:W. H. Freeman