
Concept explainers
Videos
For Exercises 1 through 20, perform each of the following steps.
a. State the hypotheses and identify the claim.
b. Find the critical value(s).
c. Compute the test value.
d. Make the decision.
e. Summarize the results.
Use the traditional method of hypothesis testing unless otherwise specified.
1. Lifetime of $1 Bills The average lifetime of circulated $1 bills is 18 months. A researcher believes that the average lifetime is not 18 months. He researched the lifetime of 50 $1 bills and found the average lifetime was 18.8 months. The population standard deviation is 2.8 months. At α = 0.02, can it be concluded that the average lifetime of a circulated $1 bill differs from 18 months?
a.
To state: The null and alternative hypotheses and identify the claim.
Answer to Problem 8.2.1RE
Null hypothesis:
Alternative hypothesis:
The claim is “the average lifetime of circulated $1 bills is not 18 months”.
Explanation of Solution
Given info:
A sample of 50 $1 bills selected and found the average lifetime was 18.8 months. The population standard deviation is 2.8 months.
Justification:
Here, the claim is that the average lifetime of circulated $1 bills is not 18 months. This can be written as
The test hypotheses are given below:
Null hypothesis: The average lifetime of circulated $1 bills is 18 months
Alternative hypothesis (claim): The average lifetime of circulated $1 bills is not 18 months.
b.
To find: The critical values.
Answer to Problem 8.2.1RE
The critical value is ±2.326.
Explanation of Solution
Calculation:
Software Procedure:
Step-by-step procedure to obtain the critical value using the MINITAB software:
- Choose Graph > Probability Distribution Plot choose View Probability > OK.
- From Distribution, choose ‘Normal’ distribution.
- Click the Shaded Area tab.
- Choose Probability Value and Both Tail for the region of the curve to shade.
- Enter the Probability value as 0.02.
- Click OK.
Output using the MINITAB software is given below:
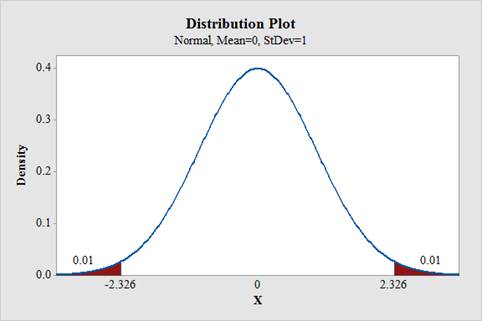
From the output, the critical value is ±2.326.
c.
To find: The test value.
Answer to Problem 8.2.1RE
The test value is 2.02.
Explanation of Solution
Calculation:
Software Procedure:
Step-by-step procedure to obtain the test value using the MINITAB software:
- Choose Stat > Basic Statistics > 1-Sample Z.
- In Summarized data, enter the sample size as 50 and mean as 18.8.
- In Standard deviation, enter 2.8.
- In Perform hypothesis test, enter the test mean as 18.
- Check Options; enter Confidence level as 98%.
- Choose not equal in alternative.
- Click OK.
Output using the MINITAB software is given below:
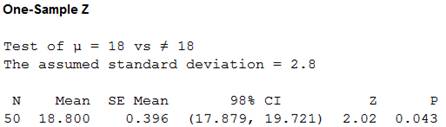
From the output, the test value is 2.02.
d.
To make: The decision.
Answer to Problem 8.2.1RE
The decision is “fail to reject the null hypothesis”.
Explanation of Solution
Calculation:
Software Procedure:
Step-by-step procedure to indicate the appropriate area and critical value using the MINITAB software:
- Choose Graph > Probability Distribution Plot choose View Probability > OK.
- From Distribution, choose ‘Normal’ distribution.
- Click the Shaded Area tab.
- Choose Probability Value and Both Tail for the region of the curve to shade.
- Enter the Probability value as 0.02.
- Enter 2.02 under show reference lines at X values.
- Click OK.
Output using the MINITAB software is given below:
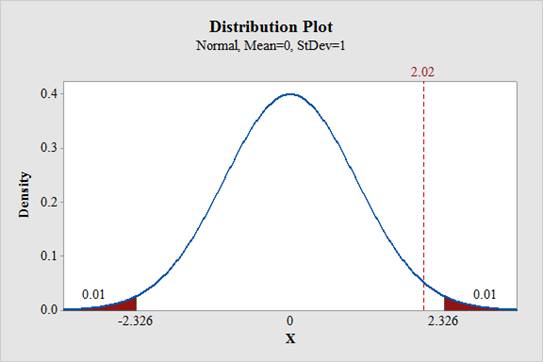
From the output, it can be observed that the test statistic value do not falls in the critical region. Therefore, the null hypothesis is not rejected.
e.
To summarize: The result.
Answer to Problem 8.2.1RE
The conclusion is that, there is no enough evidence to support the claim that the average lifetime of circulated $1 bills is not 18 months.
Explanation of Solution
Justification:
From part d, the null hypothesis is not rejected. Therefore, there is no enough evidence to support the claim that the average lifetime of circulated $1 bills is not 18 months.
Want to see more full solutions like this?
Chapter 8 Solutions
Connect hosted by ALEKS Access Card 52-Week for Elementary Statistics: A Step by Step Approach


- A dental assistant is interested in the proportion of patients that need a root canal. Let the proportion of patients that need a root canal be p. If the dental assistant wanted to know if the proportion of patients that need a root canal is more than 20%, what are the null and alternative hypotheses? Select the correct answer below: H0: p=0.20; Ha: p<0.20 H0: p>0.20; Ha: p=0.20 H0: p=0.20; Ha: p>0.20 H0: μ=0.20; Ha: μ>0.20arrow_forwardYou are working for the South Tahoe Tourist Bureau and are interested in determining if there is a relationship between the casino people frequent and the type of gambling that they do at the casino Table Games Slots Sports Harrah’s 50 60 12 Hard Rock 18 22 6 MontBleu 33 29 20 Harvey’s 41 39 20 a. State the null and alternative hypotheses. b. State which hypothesis test should be used. Calculate the p-Value and state the command you entered in the calculator. c. State the conclusion in the context of the problem.arrow_forwardFor each of the following sets of hypotheses, sample sizes, and test statistic values, calculate the appropriate p-v (It may help to draw a picture for each case.) H0: π = 0.6 Ha: π ≠ 0.6, sample size n = 150, test statistic z = 0.83. H0: µ = 23 Ha: µ ≠ 23, sample size n = 20, test statistic t = 2.17.arrow_forward
- For each of the following scenarios, state the null and alternative hypotheses. Scenario A: You read in a report that preschool-aged children have on average 5.2 books at home. You are concerned that children in your community have fewer books.arrow_forwardYou are given the following hypotheses H 0 :p=0.3 H A :p not equal 0.3 We know that the sample size 90. For what sample proportion would the pvalue be equal to 0.1? Assume that all conditions necessary for Inference are satisfied.arrow_forwardFollow the steps in testing hypothesis to answer the problem:arrow_forward
- Use the traditional method in testing the hypothesis in the problems below. In each problem, state the following:a. State the hypotheses and identify the claim.b. Find the critical value(s)c. Find the test value The manager of the cosmetics section of a large department store wants to determine whether newspaper advertising really does affect sales. For her experiment, she randomly selects 15 items currently in stock and proceeds to establish a baseline. The 15 items are priced at their usual competitive values, and the quantity of each item sold for a 1-week period is recorded. Then, without changing their price, she places a large ad in the newspaper, advertising the 15 items. Again, she records the quantity sold for a 1-week period. The results follow. Item 1 2 3 4 5 6 7 8 9 10 11 12 13 14 15No. of Items Sold Before Ad 25 18 3 42 16 20 23 32 60 40 27 7 13 23 16No. of Items Sold After Ad 32 24 7 40 19 25 23 35 60 43 28 11 12 32 28arrow_forwardIf the proportion of the population in City A that is over 65 years old is p1 and the proportion of the population in City B that is over 65 years old is p2, what is the null hypothesis for a test to determine if the proportion of the population that is over 65 years old is greater in City A? Select the correct answer below: H0: p1−p2=0 H0: p1−p2>0 H0: p1−p2<0 H0: p1−p2≠0arrow_forwardGiven the situation below, create a problem and determine (a) the null and alternative hypotheses, (b) test statistic, (c) rejection region, and (d) applicability of the CLT.arrow_forward
- Given that the P-value for the hypothesis test is 0.501, what do you conclude? Does it appear that the heights were obtained through measurement or that the subjects reported their heights?arrow_forwardUse the 7 steps in Hypothesis Testing in answering the problems below.arrow_forward1.Respond to the following questions in accordance with characteristics of hypothesis testing. a.If you want to see if the average gestational length among African American women is different from the national average of 39 weeks, how would you set up the null and two-sided alternative hypotheses? b.If you want to see if the average gestational length among African American women is less than the national average of 39 weeks, how would you set up the null and one-sided alternative hypotheses? c.In other words, what is a P-value? d.If α is 0.10 and you find a P-value of 0.08 in your hypothesis test, what would you conclude? e.How do you calculate the standard error of ?̅?arrow_forward
 MATLAB: An Introduction with ApplicationsStatisticsISBN:9781119256830Author:Amos GilatPublisher:John Wiley & Sons Inc
 Probability and Statistics for Engineering and th...StatisticsISBN:9781305251809Author:Jay L. DevorePublisher:Cengage Learning
 Statistics for The Behavioral Sciences (MindTap C...StatisticsISBN:9781305504912Author:Frederick J Gravetter, Larry B. WallnauPublisher:Cengage Learning
 Elementary Statistics: Picturing the World (7th E...StatisticsISBN:9780134683416Author:Ron Larson, Betsy FarberPublisher:PEARSON
 The Basic Practice of StatisticsStatisticsISBN:9781319042578Author:David S. Moore, William I. Notz, Michael A. FlignerPublisher:W. H. Freeman
 Introduction to the Practice of StatisticsStatisticsISBN:9781319013387Author:David S. Moore, George P. McCabe, Bruce A. CraigPublisher:W. H. Freeman