Horngren's Financial & Managerial Accounting, The Managerial Chapters (5th Edition)
5th Edition
ISBN: 9780133851298
Author: Tracie L. Miller-Nobles, Brenda L. Mattison, Ella Mae Matsumura
Publisher: PEARSON
expand_more
expand_more
format_list_bulleted
Videos
Textbook Question
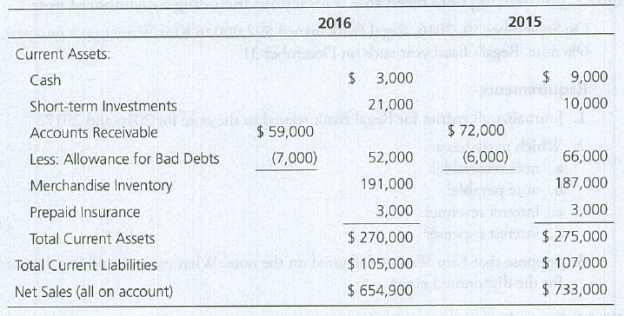
Chapter 8, Problem 8.25E
Evaluating ratio data
Chippewa Carpets reported the following amounts in its 2016 financial statements. The 2015 figures are given for comparison.
Requirements
- 1. Calculate Chippewa’s acid-test ratio for 2016. (Round to two decimals.) Determine whether Chippewa’s acid-test ratio improved or deteriorated from 2015 to 2016. How does Chippewa’s acid-test ratio compare with the industry average of 0.80?
- 2. Calculate Chippewa’s
accounts receivable turnover ratio. (Round to two decimals.) How does Chippewa’s ratio compare to the industry average accounts receivable turnover of 10? - 3. Calculate the days’ sales in receivables for 2016. (Round to the nearest day.) How do the results compare with Chippewa’s credit terms of net 30?
Expert Solution & Answer

Trending nowThis is a popular solution!

Students have asked these similar questions
Access the February 21, 2017, filing of the December 31, 2016, 10-K report of The Hershey Company (ticker: HSY) at SEC.gov and complete the following requirements. Required Compute or identify the following profitability ratios of Hershey for its years ending December 31, 2016, and December 31, 2015. Interpret its profitability using the results obtained for these two years. 1. Profit margin ratio (round the percent to one decimal). 2. Gross profit ratio (round the percent to one decimal). 3. Return on total assets (round the percent to one decimal). (Total assets at year-end 2014 were $5,622,870 in thousands.) 4. Return on common stockholders’ equity (round the percent to one decimal). (Total shareholders’ equity at year-end 2014 was $1,519,530 in thousands.) 5. Basic net income per common share (round to the nearest cent).
Compute trend percentages for the following items taken from the financial statements of Lopez Plumbing over a five-year period. Treat 2014 as the base year. State whether the trends are favorable or unfavorable. (Dollar amounts are stated in thousands.)
2018
2017
2016
2015
2014
Sales
$81,400
$74,000
$61,500
$59,000
$50,000
Cost of Goods Sold
58,500
48,000
40,500
37,000
30,000
.
Using the calculated different ratios for Abcam in 2015 below. Comment on your result and contrast with the evolution in 2016 and 2017. At the end of each type of ratio, provide a short paragraph that gives a final note on the outlook for the company. Last, provide a final paragraph that summarise Abcam’s financial situation and give your recommendations to the management.
Chapter 8 Solutions
Horngren's Financial & Managerial Accounting, The Managerial Chapters (5th Edition)
Ch. 8 - Prob. 1QCCh. 8 - When recording credit card or debit card sales...Ch. 8 - Which of the following is a limitation of the...Ch. 8 - The entry to record a write-off of an...Ch. 8 - Brickman Corporation uses the allowance method to...Ch. 8 - Brickmans ending balance of Accounts Receivable is...Ch. 8 - At December 31 year-end, Crain Corporation has an...Ch. 8 - Using the data in the preceding question, what...Ch. 8 - At year-end, Schultz, Inc. has cash of 11,600,...Ch. 8 - Using the data in the preceding question, assume...
Ch. 8 - What is the difference between accounts receivable...Ch. 8 - Prob. 2RQCh. 8 - Prob. 3RQCh. 8 - When dealing with receivables, give an example of...Ch. 8 - What type of account must the sum of all...Ch. 8 - Prob. 6RQCh. 8 - What are two common methods used when accepting...Ch. 8 - What occurs when a business factors its...Ch. 8 - What occurs when a business pledges its...Ch. 8 - Prob. 10RQCh. 8 - Prob. 11RQCh. 8 - Prob. 12RQCh. 8 - Prob. 13RQCh. 8 - When using the allowance method, how are accounts...Ch. 8 - Prob. 15RQCh. 8 - Prob. 16RQCh. 8 - How does the percent- of-sales method compute bad...Ch. 8 - How do the percent-of-receivables and aging-of-...Ch. 8 - What is the difference between the...Ch. 8 - Prob. 20RQCh. 8 - Prob. 21RQCh. 8 - Prob. 22RQCh. 8 - Prob. 23RQCh. 8 - Prob. 24RQCh. 8 - Prob. 8.1SECh. 8 - Prob. 8.2SECh. 8 - Applying the direct write-off method to account...Ch. 8 - Collecting a receivable previously written...Ch. 8 - Prob. 8.5SECh. 8 - Applying the allowance method (percent-of-sales)...Ch. 8 - Applying the allowance method...Ch. 8 - Prob. 8.8SECh. 8 - Prob. 8.9SECh. 8 - Accounting for a note receivable On June 6,...Ch. 8 - Prob. 8.11SECh. 8 - Recording a dishonored note receivable Midway...Ch. 8 - Prob. 8.13SECh. 8 - Defining common receivables terms Match the terms...Ch. 8 - Prob. 8.15ECh. 8 - Journalizing transactions using the direct...Ch. 8 - Use the following information to answer Exercises...Ch. 8 - Use the following information to answer Exercises...Ch. 8 - Accounting for uncollectible accounts using the...Ch. 8 - Journalizing transactions using the direct...Ch. 8 - Journalizing credit card sales, note receivable...Ch. 8 - Journalizing note receivable transactions...Ch. 8 - Journalizing note receivable transactions The...Ch. 8 - Journalizing note receivable transactions Like New...Ch. 8 - Evaluating ratio data Chippewa Carpets reported...Ch. 8 - Prob. 8.26ECh. 8 - Prob. 8.27APCh. 8 - Accounting for uncollectible accounts using the...Ch. 8 - Accounting for uncollectible accounts using the...Ch. 8 - Accounting for uncollectible accounts...Ch. 8 - Accounting for notes receivable and accruing...Ch. 8 - Accounting for notes receivable, dishonored notes,...Ch. 8 - Using ratio data to evaluate a companys financial...Ch. 8 - Prob. 8.34BPCh. 8 - Prob. 8.35BPCh. 8 - Accounting for uncollectible accounts using the...Ch. 8 - Accounting for uncollectible accounts...Ch. 8 - Accounting for notes receivable and accruing...Ch. 8 - Accounting for notes receivable, dishonored notes,...Ch. 8 - Prob. 8.40BPCh. 8 - Prob. 8.41CPCh. 8 - Prob. 8.42PSCh. 8 - Prob. 8.1CTDCCh. 8 - Paulines Pottery has always used the direct...Ch. 8 - Prob. 8.1CTFCCh. 8 - Use Starbucks Corporations Fiscal 2013 Annual...
Knowledge Booster


Learn more about
Need a deep-dive on the concept behind this application? Look no further. Learn more about this topic, accounting and related others by exploring similar questions and additional content below.Similar questions
- Financial statement data for years ending December 31 for Latchkey Company follows: a. Determine the ratio of sales to assets for 2016 and 2015. b. Does the change in the ratio of sales to assets from 2015 to 2016 indicate a favorable or an unfavorable trend?arrow_forward(Disclosure of Estimates) Nancy Tercek, the financial vice president, and Margaret Lilly, the controller, of Romine Manufacturing Company are reviewing the financial ratios of the company for the years 2017 and 2018. The financial vice president notes that the profit margin on sales ratio has increased from 6% to 12%, a hefty gain for the 2-year period. Tercek is in the process of issuing a media release that emphasizes the efficiency of Romine Manufacturing in controlling cost. Margaret Lilly knows that the difference in ratios is due primarily to an earlier company decision to reduce the estimates of warranty and bad debt expense for 2018. The controller, not sure of her supervisor’s motives, hesitates to suggest to Tercek that the company’s improvement is unrelated to efficiency in controlling cost. To complicate matters, the media release is scheduledin a few days.Instructions(a) What, if any, is the ethical dilemma in this situation?(b) Should Lilly, the controller, remain silent?…arrow_forwardComputing and Interpreting Financial Statement Ratios Following are selected ratios of Norfolk Southern for 2018 and 2017. Return on Assets (ROA) Component 2018 2017 Profitability (Net income/Sales) 25.3% 53.2% Productivity (Sales/Average assets) 0.338 0.319 a. Was the company profitable in 2018?Answer b. Was the company more profitable in 2018 or 2017?Answer c. Is the change in productivity a positive or negative development?Answer d. Compute the company’s ROA for 2018 and for 2017. Note: Round answers to one decimal places (example: 10.4%). ROA 2018 Answer 2017 Answer e. From the information provided, which of the following best explains the change in ROA during 2018? Answerarrow_forward
- The comparative statements of Corbin Company are presented below. CORBIN COMPANYIncome StatementFor the Years Ended December 31 2017 2016 Net sales (all on account) $600,500 $520,200 Expenses Cost of goods sold 414,600 354,200 Selling and administrative 119,900 113,300 Interest expense 8,200 5,100 Income tax expense 17,100 14,700 Total expenses 559,800 487,300 Net income $ 40,700 $ 32,900 CORBIN COMPANYBalance SheetsDecember 31 Assets 2017 2016 Current assets Cash $ 21,100 $ 17,600 Short-term investments 17,100 15,200 Accounts receivable (net) 86,100 73,000 Inventory 89,400 70,100 Total current assets 213,700 175,900 Plant assets (net) 423,800 383,200 Total assets $637,500 $559,100 Liabilities and Stockholders’ Equity…arrow_forwardWhat is the comparison (analysis) of the Current Ratio of Industry Average Ratio and the Company A Ratio? The current ratios has decreased and increased. Why? Industry Average Current Ratio 2015: 3.11 2016: 3.18 2017: 1.75 2018: 1.77 2019: 2.19 Company A Current Ratio 2015: 3.02 2016: 2.25 2017: 2.56 2018: 1.74 2019: 1.60arrow_forwardWhat is the comparison (analysis) of the ROA of Industry Average Ratio and the Company A Ratio? The Total ROA ratios has decreased and increased. Why? Industry Average ROA 2015: 3.40% 2016: 4.31% 2017: 2.28% 2018: 3.19% 2019: 3.90% Company A Total ROA 2015: 2.16% 2016: 1.10% 2017: 1.96% 2018: 1.99% 2019: 1.65%arrow_forward
- Income statements (in’000s) of Future Lifestyle and Arvind Lifestyle, the two top textile brands, are provided below. Future lifestyle profits declined in 2014-15. Although Arvind lifestyle posted loss in both periods, the loss has declined. Required: a. Examine the performance of Future Lifestyle for the two years and explain why profit has declined despite increase in revenue. b. Examine how the performance of Arvind Lifestyle for the two years and explain how Arvind lifestyle improved its performance. c. Compare the performance of the two companies for the year ending March 2015 and explain the differences in performance of the two companies. (Hint: Prepare common size income statement to analyse the cost structure of the two companies). Future Lifestyle Arvind Lifestyle March 2014 March 2015 March 2014 March 2015 INCOME Revenue 3122.86 3305.58 1764.95 2291.08 EXPENDITURE Raw Materials…arrow_forward(Analysis of Given Ratios) Picasso Company is a wholesale distributor of packaging equipment and supplies. The company’s sales have averaged about $900,000 annually for the 3-year period 2015–2017. The firm’s total assets at the end of 2017 amounted to $850,000.The president of Picasso Company has asked the controller to prepare a report that summarizes the financial aspects of the company’s operations for the past 3 years. This report will be presented to the board of directors at their next meeting.In addition to comparative financial statements, the controller has decided to present a number of relevant financial ratios which can assist in the identification and interpretation of trends. At the request of the controller, the accounting staff has calculated the following ratios for the 3-year period 2015–2017. Check the below image for following ratios. In preparation of the report, the controller has decided first to examine the financial ratios independent of any other data to…arrow_forwardFind the following financial ratios for LVMH Moet Hennessy Louis Vuitton SA (use year-end figures rather than average values where appropriate) (Round your answers to 2 decimal places (e.g., 32.16).) : 2015 2016 Short-term solvency ratios: Current ratio Quick ratio Cash ratio Asset utilization ratios: Total asset turnover Inventory turnover Receivables turnover Long-term solvency ratios: Total debt ratio Debt–equity ratio Equity multiplier Times interest earned ratio Profitability ratios: Profit margin % % Return on assets % % Return on equity % %arrow_forward
- Compute trend percents for the above accounts, using 2017 as the base year. For each of the three accounts, state whether the situation as revealed by the trend percents appears to be favorable or unfavorable. Sales $ 666,761 $ 432,962 $ 344,990 $ 249,090 $ 180,500 Cost of goods sold 329,263 213,901 172,445 124,054 88,445 Accounts receivable 32,138 25,242 23,632 14,547 12,328arrow_forwardComputing and Interpreting Financial Statement Ratios Following are selected ratios of Norfolk Southern for 2018 and 2017. Return on Assets (ROA) Component 2018 2017 Profitability (Net income/Sales) 24.3% 52.2% Productivity (Sales/Average assets) 0.328 0.309 a. Was the company profitable in 2018?AnswerYesNo b. Was the company more profitable in 2018 or 2017?Answer20172018 c. Is the change in productivity a positive or negative development?AnswerPositiveNegative d. Compute the company’s ROA for 2018 and for 2017.Note: Round answers to one decimal places (example: 10.4%). ROA 2018 Answer 2017 Answerarrow_forwardComparing Two Companies in the Same Industry: Chipotle and Panera Bread This case should be completed after responding to the requirements in Decision Case 13-2. Refer to the financial statement information of Chipotle and Panera Bread reprinted at the back of the book. Required Using the format in Example 13-5, prepare common-size comparative income statements for 2014 and 2013, for Panera Bread. Use total revenues as the base (i.e., 100%). Round all percentages to the nearest one-tenth of a percent. The common-size comparative income statements indicate the relative importance of items on the statement. Compare the common-size income statements of Panera Bread and Chipotle. What are the most important differences between the two companies income statements? Using the format in Example 13-4, prepare common-size comparative balance sheets at the end of 2014 and 2013, for Panera Bread. Round all percentages to the nearest one-tenth of a percent. The common-size comparative balance sheets indicate the relative importance of items on the statement. Compare the common-size balance sheets of Panera Bread and Chipotle. What are the most important differences between the two companies balance sheets?arrow_forward
arrow_back_ios
SEE MORE QUESTIONS
arrow_forward_ios
Recommended textbooks for you

 Cornerstones of Financial AccountingAccountingISBN:9781337690881Author:Jay Rich, Jeff JonesPublisher:Cengage Learning
 Financial Accounting: The Impact on Decision Make...AccountingISBN:9781305654174Author:Gary A. Porter, Curtis L. NortonPublisher:Cengage Learning
 Managerial AccountingAccountingISBN:9781337912020Author:Carl Warren, Ph.d. Cma William B. TaylerPublisher:South-Western College PubPrinciples of Accounting Volume 1AccountingISBN:9781947172685Author:OpenStaxPublisher:OpenStax College
Cornerstones of Financial Accounting
Accounting
ISBN:9781337690881
Author:Jay Rich, Jeff Jones
Publisher:Cengage Learning
Financial Accounting: The Impact on Decision Make...
Accounting
ISBN:9781305654174
Author:Gary A. Porter, Curtis L. Norton
Publisher:Cengage Learning
Managerial Accounting
Accounting
ISBN:9781337912020
Author:Carl Warren, Ph.d. Cma William B. Tayler
Publisher:South-Western College Pub
Principles of Accounting Volume 1
Accounting
ISBN:9781947172685
Author:OpenStax
Publisher:OpenStax College
How To Analyze an Income Statement; Author: Daniel Pronk;https://www.youtube.com/watch?v=uVHGgSXtQmE;License: Standard Youtube License