Applied Statistics in Business and Economics with Connect Access Card with LearnSmart
5th Edition
ISBN: 9781259396656
Author: David Doane, Lori Seward Senior Instructor of Operations Management
Publisher: McGraw-Hill Education
bartleby

Concept explainers

bartleby

Videos

Textbook Question
Book Icon
Chapter 8, Problem 94CE

This is an exercise using Excel. (a) Use =RANDBETWEEN(0,99) to create 20 samples of size n = 4 by choosing two-digit random numbers between 00 and 99. (b) For each sample, calculate the mean. (c) Make a histogram of the 80 individual x-values using bins 10 units wide (i.e., 0, 10, 20, . . . , 100). Describe the shape of the histogram. (d) Make a histogram of your 20 sample means using bins 10 units wide. (e) Discuss the histogram shape. Does the Central Limit Theorem seem to be working? (f) Find the mean of your 20 sample means. Was it what you would expect? Explain. (g) Find the standard deviation of your 20 sample means. Was it what you would expect?

a.

Expert Solution
Check Mark
To determine

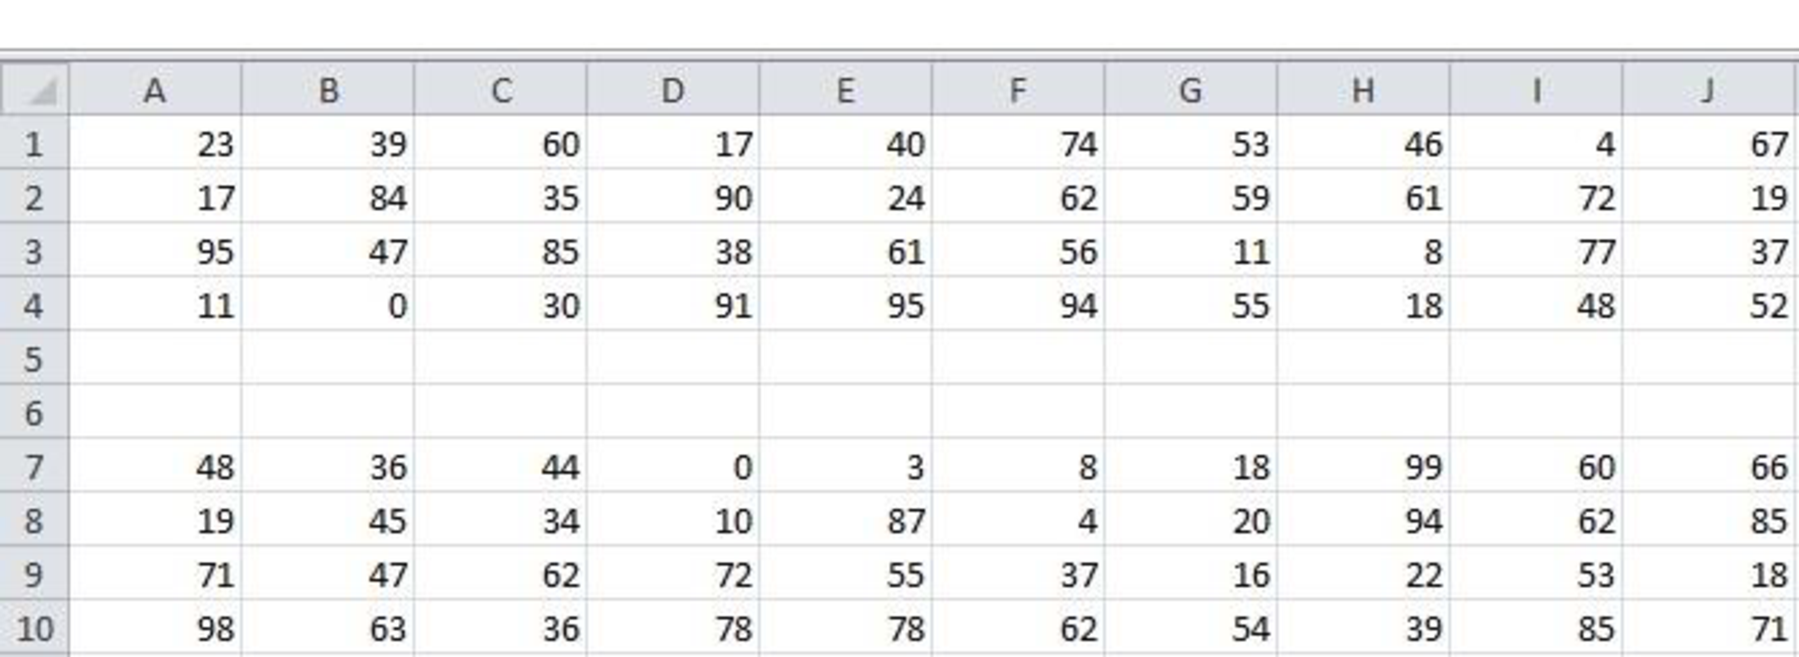
Create 20 samples by choosing two digit random numbers between 00 and 99 of size n=4.

Answer to Problem 94CE

The random numbers are given below:

Applied Statistics in Business and Economics with Connect Access Card with LearnSmart, Chapter 8, Problem 94CE , additional homework tip  1

Explanation of Solution

Calculation:

Answer will vary. One of the possible answers is given below:

Software procedure:

Step-by-step procedure to find the standard deviation using the EXCEL software is given below:

  • • Open an EXCEL file.
  • • In A1, enter the formula “=RANDBETWEEN(0,99)”.
  • • Click Enter.
  • • Drag the cells to bottom 4 rows and 20 columns to the right.

b.

Expert Solution
Check Mark
To determine

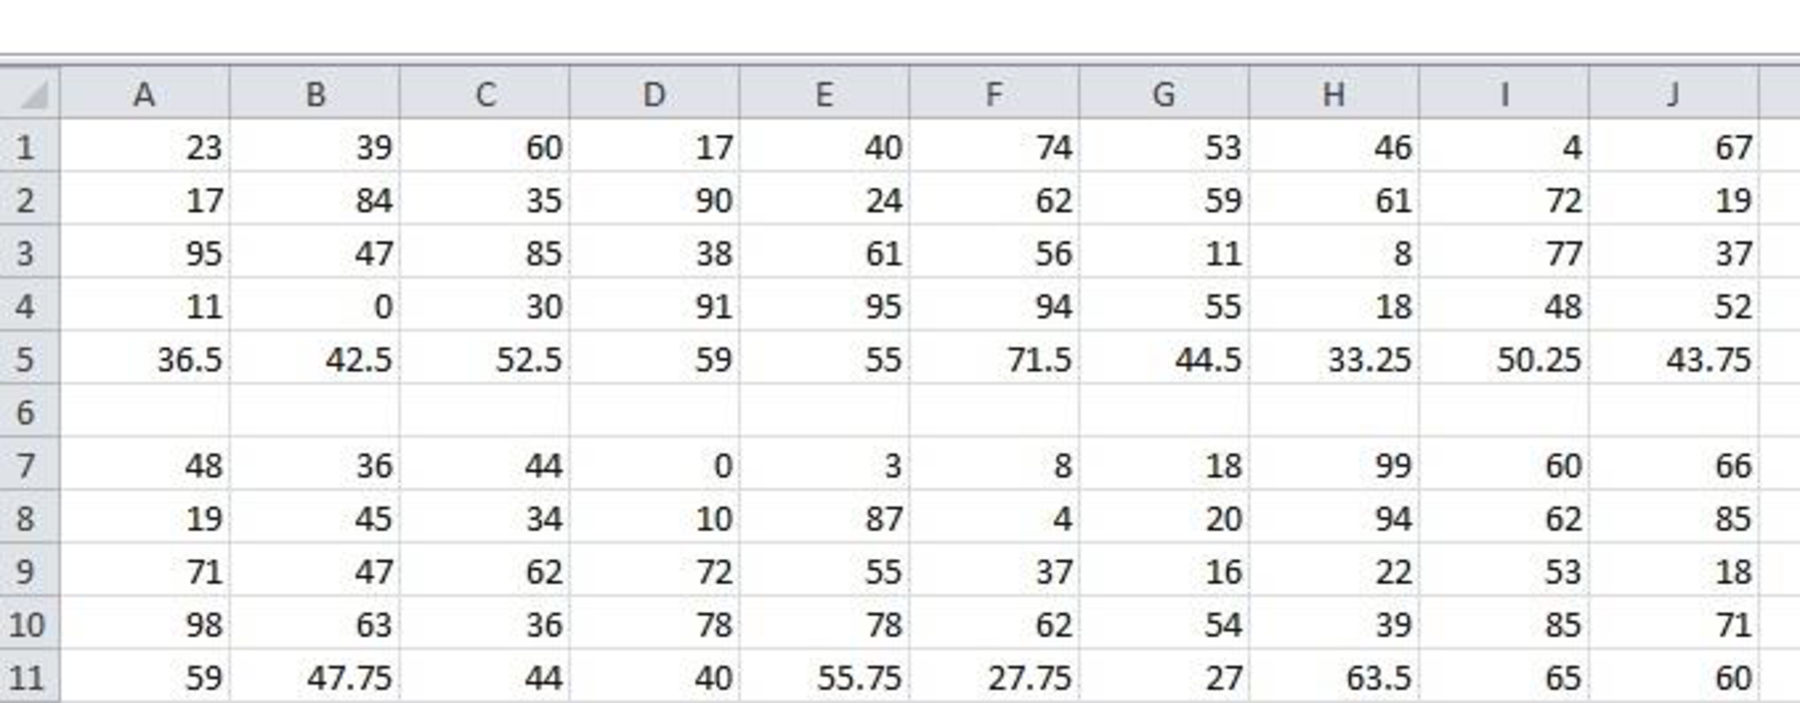
Calculate the mean for each sample.

Answer to Problem 94CE

The mean for each sample is given below:

Applied Statistics in Business and Economics with Connect Access Card with LearnSmart, Chapter 8, Problem 94CE , additional homework tip  2

Explanation of Solution

Calculation:

Mean:

The arithmetic mean(also called the average)is the most commonly used measure of central tendency. It is calculated by summing the observed numerical values of a variable in a set of data and then dividing the total by the number of observations involved.

Software procedure:

Step-by-step procedure to find the mean for each sample using the EXCEL software is given below:

  • • Open an EXCEL file.
  • • In A1, enter the formula “=RANDBETWEEN(0,99)”.
  • • Click Enter.
  • • Drag the cells to bottom 4 rows and 20 columns to the right.
  • • In A5, enter the formula “=AVERAGE(A1:A4)”.
  • • Click Enter.
  • • Drag the cells for 20 columns to the right.

c.

Expert Solution
Check Mark
To determine

Make a histogram of 80 individual x-values using bins of 10 units wide and describe the shape of the histogram.

Answer to Problem 94CE

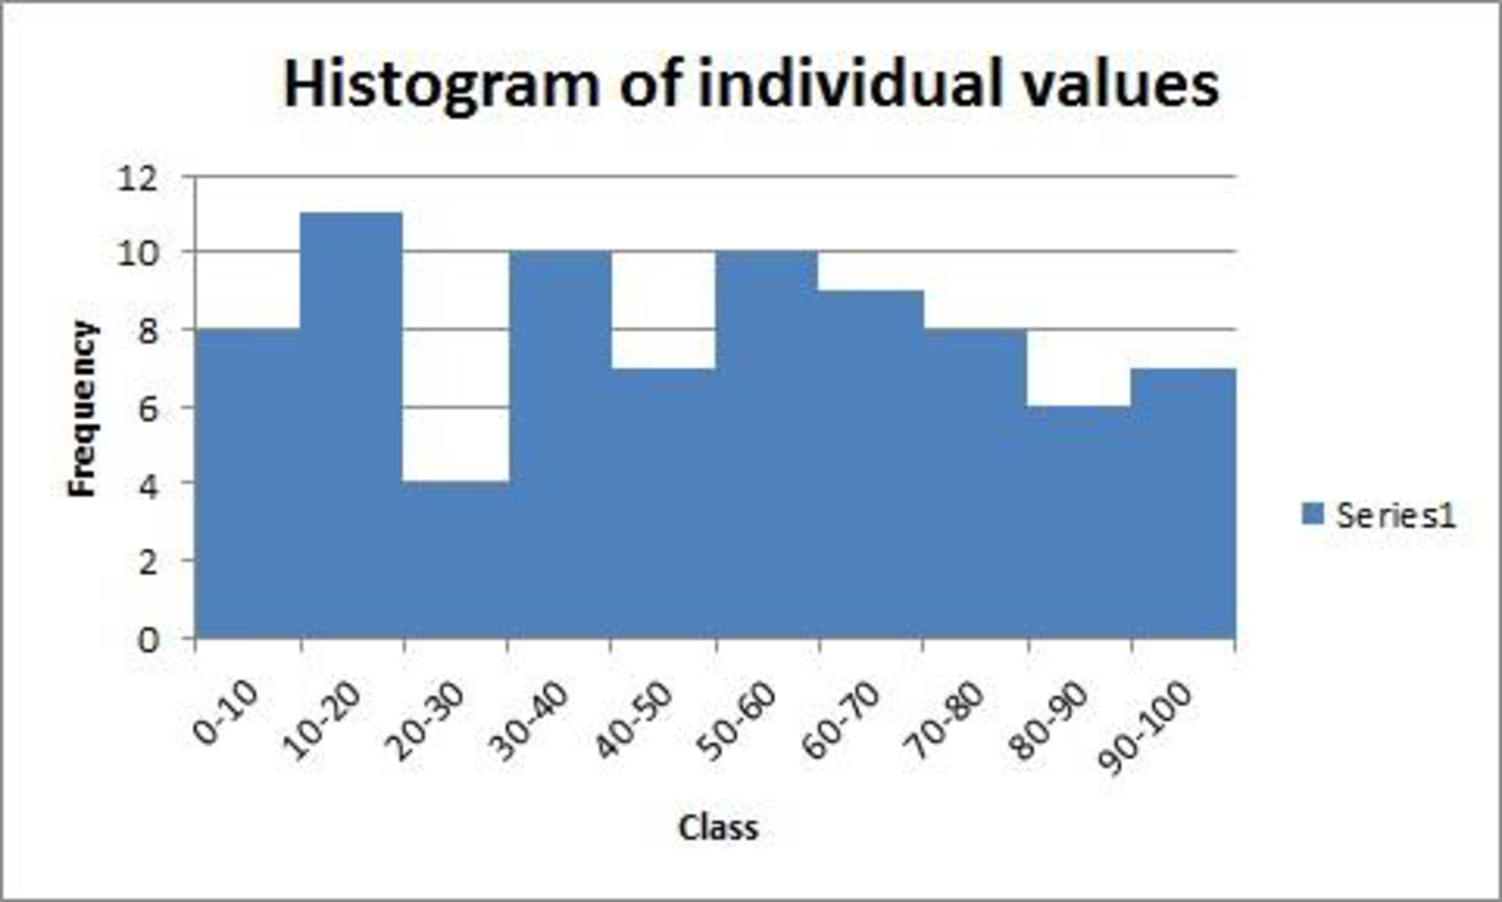
The histogram of 80 individual x-values using 10 units wide is given below:

Applied Statistics in Business and Economics with Connect Access Card with LearnSmart, Chapter 8, Problem 94CE , additional homework tip  3

Explanation of Solution

Calculation

The values are ranging from 0 to 99. The way to arrange the data in a group is, the first class takes values from0-10, and the second class takes 10-20 and so on.

Now, count the frequency (number of values) in each bin that is, 8is in bin 0-10 because 8 values occur in this interval. Similarly for the remaining bins frequencies are obtained.

The frequency table is as follows,

ClassFrequency
0-108
10-2011
20-304
30-4010
40-507
50-6010
60-709
70-808
80-906
90-1007
Total80

Histogram:

It is bar graph for a quantitative data where the bars have a particular order and specific meaning for the bin widths.

Software procedure:

Step-by-step software procedure to obtain histogram using EXCEL is as follows:

  • • Open an EXCEL file.
  • • In column A, enter the column of class and in column B enter the column of Frequency.
  • • Select the data that is to be displayed.
  • • Select Insert > Column
  • • Choose Clustered column under 2-D column.
  • • Double click on the bars and reduce the Gap Width to 0
  • • Click on the chart > select Layout from the Chart Tools.
  • • Select Chart Title>Above Chart.
  • • Enterin the dialog box.
  • • Select Axis Title>Primary Horizontal Axis Title > Title Below Axis.
  • • EnterClass in the dialog box.
  • • Select Axis Title>Primary Vertical Axis Title > Rotated Title.
  • • Enter Frequency in the dialog box.

Symmetric distribution:

The distribution is said to be symmetric when the left half is the mirror image of the right half.

Left skewed distribution:

The distribution is said to be left skewed, if most of the observations are spread out on the left side. That is, the left tail is more elongated than the right tail.

Right skewed distribution:

The distribution is said to be left skewed, if most of the observations are spread out on the right side. That is, the right tail is more elongated than the left tail.

Here, the values are spread out almost equally on both sides. Thus, the histogram is nearly symmetric.

d.

Expert Solution
Check Mark
To determine

Make a histogram of 20 sample means using bins of 10 units wide and describe the shape of the histogram.

Answer to Problem 94CE

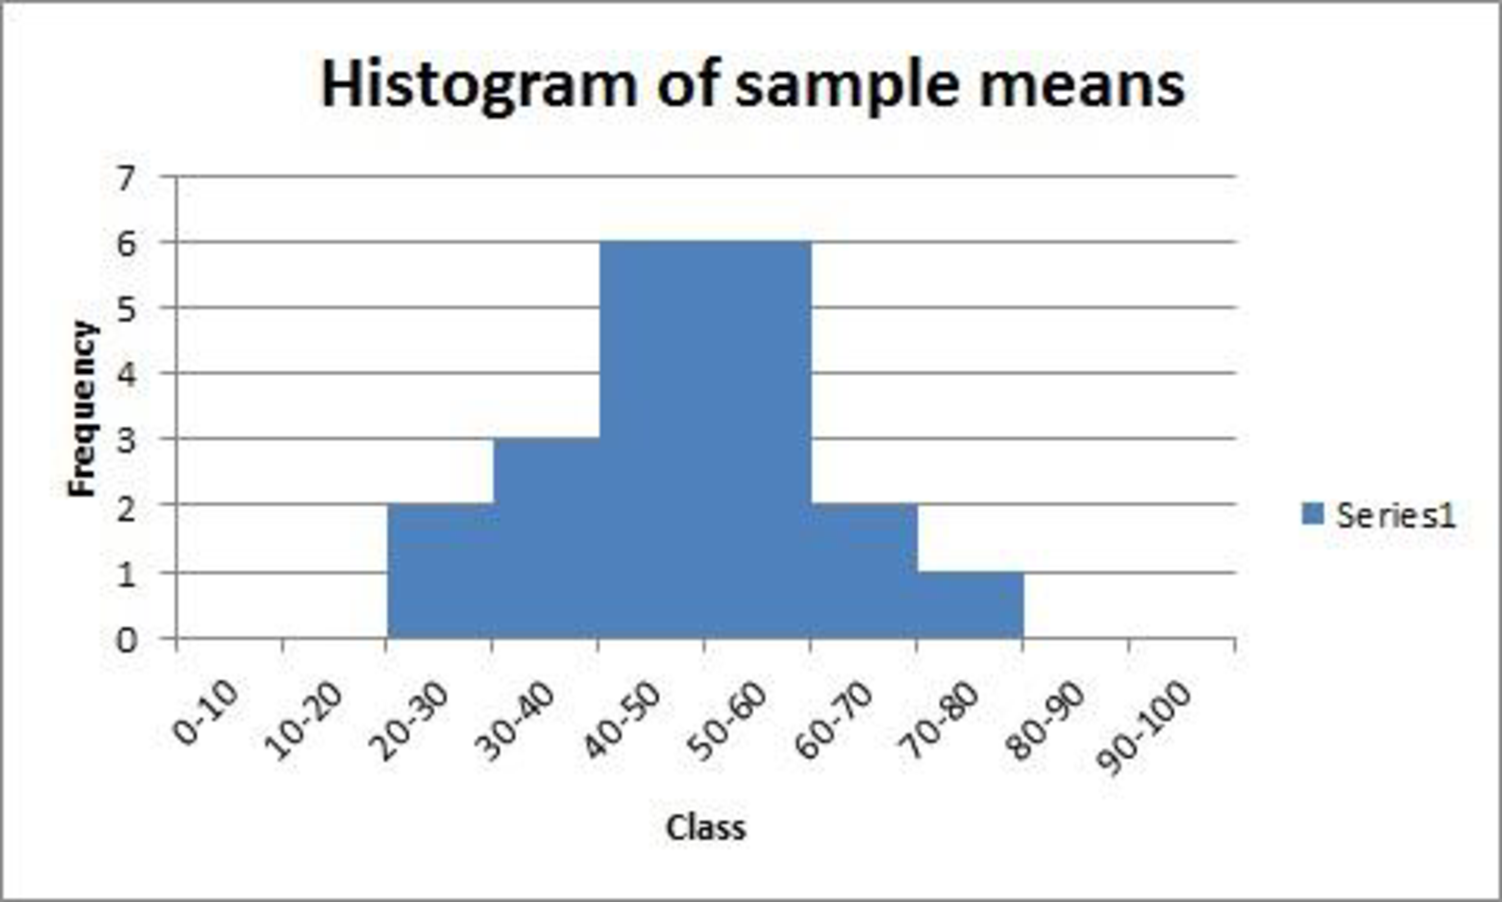
The histogram of 20 sample means using 10 units wide is given below:

Applied Statistics in Business and Economics with Connect Access Card with LearnSmart, Chapter 8, Problem 94CE , additional homework tip  4

Explanation of Solution

Calculation

Here, count the frequency (number of values) in each bin that is, 0 is in bin 0-10 because none of the values of sample means occur in this interval. Similarly for the remaining bins frequencies are obtained.

The frequency table is as follows,

ClassFrequency
0-100
10-200
20-302
30-403
40-506
50-606
60-702
70-801
80-900
90-1000
Total20

Software procedure:

Step-by-step software procedure to obtain histogram using EXCEL is as follows:

  • • Open an EXCEL file.
  • • In column A, enter the column of class and in column B enter the column of Frequency.
  • • Select the data that is to be displayed.
  • • Select Insert > Column
  • • Choose Clustered column under 2-D column.
  • • Double click on the bars and reduce the Gap Width to 0
  • • Click on the chart > select Layout from the Chart Tools.
  • • Select Chart Title>Above Chart.
  • • Enterin the dialog box.
  • • Select Axis Title>Primary Horizontal Axis Title > Title Below Axis.
  • • EnterClass in the dialog box.
  • • Select Axis Title>Primary Vertical Axis Title > Rotated Title.
  • • Enter Frequency in the dialog box.

e.

Expert Solution
Check Mark
To determine

Describe the shape of the histogram and explain whether the Central Limit Theorem seem to be working or not.

Answer to Problem 94CE

The shape of the histogram is symmetric. The central limit theorem seems to be working in the situation.

Explanation of Solution

For the histogram of sample means, the left half is the mirror image of the right half. Thus, the distribution of sample means is symmetric.

Central limit theorem for a mean:

If a random sample of size n is taken from a population having mean μ and standard deviation σ then, as the sample size increases (n30), the sample mean X¯ approaches the normal distribution with mean μ and standard deviation σx¯=σn.

The three main points about the sample mean is:

  • • If the population is normal, then the sample mean has a normal distribution. The mean of the distribution is μ with a standard error of σn.
  • • The distribution of the sample mean converges to the population mean as the sample size increases.
  • • According to the theorem, even if the population is not normal, the sample means have approximately a normal distribution as the sample size becomes large.

According to the central limit theorem, distribution of the sample means converges to the normal distribution as sample size increases. Thus, the central limit theorem seems to be working in the situation.

f.

Expert Solution
Check Mark
To determine

Find the mean of the 20 sample means and explain whether it was expected one or not.

Answer to Problem 94CE

  • The mean of the 20 sample means is 48.93. The obtained value of mean is close to the expected value.

Explanation of Solution

Calculation:

Software procedure:

Step-by-step procedure to find the mean using the EXCEL software is given below:

  • • Open an EXCEL file.
  • • Enter the sample mean values from A1 through A20.
  • • In B1, enter the formula “=AVERAGE(A1:A20)”.
  • • Click Enter.
  • Output using EXCEL software is given below:

Applied Statistics in Business and Economics with Connect Access Card with LearnSmart, Chapter 8, Problem 94CE , additional homework tip  5

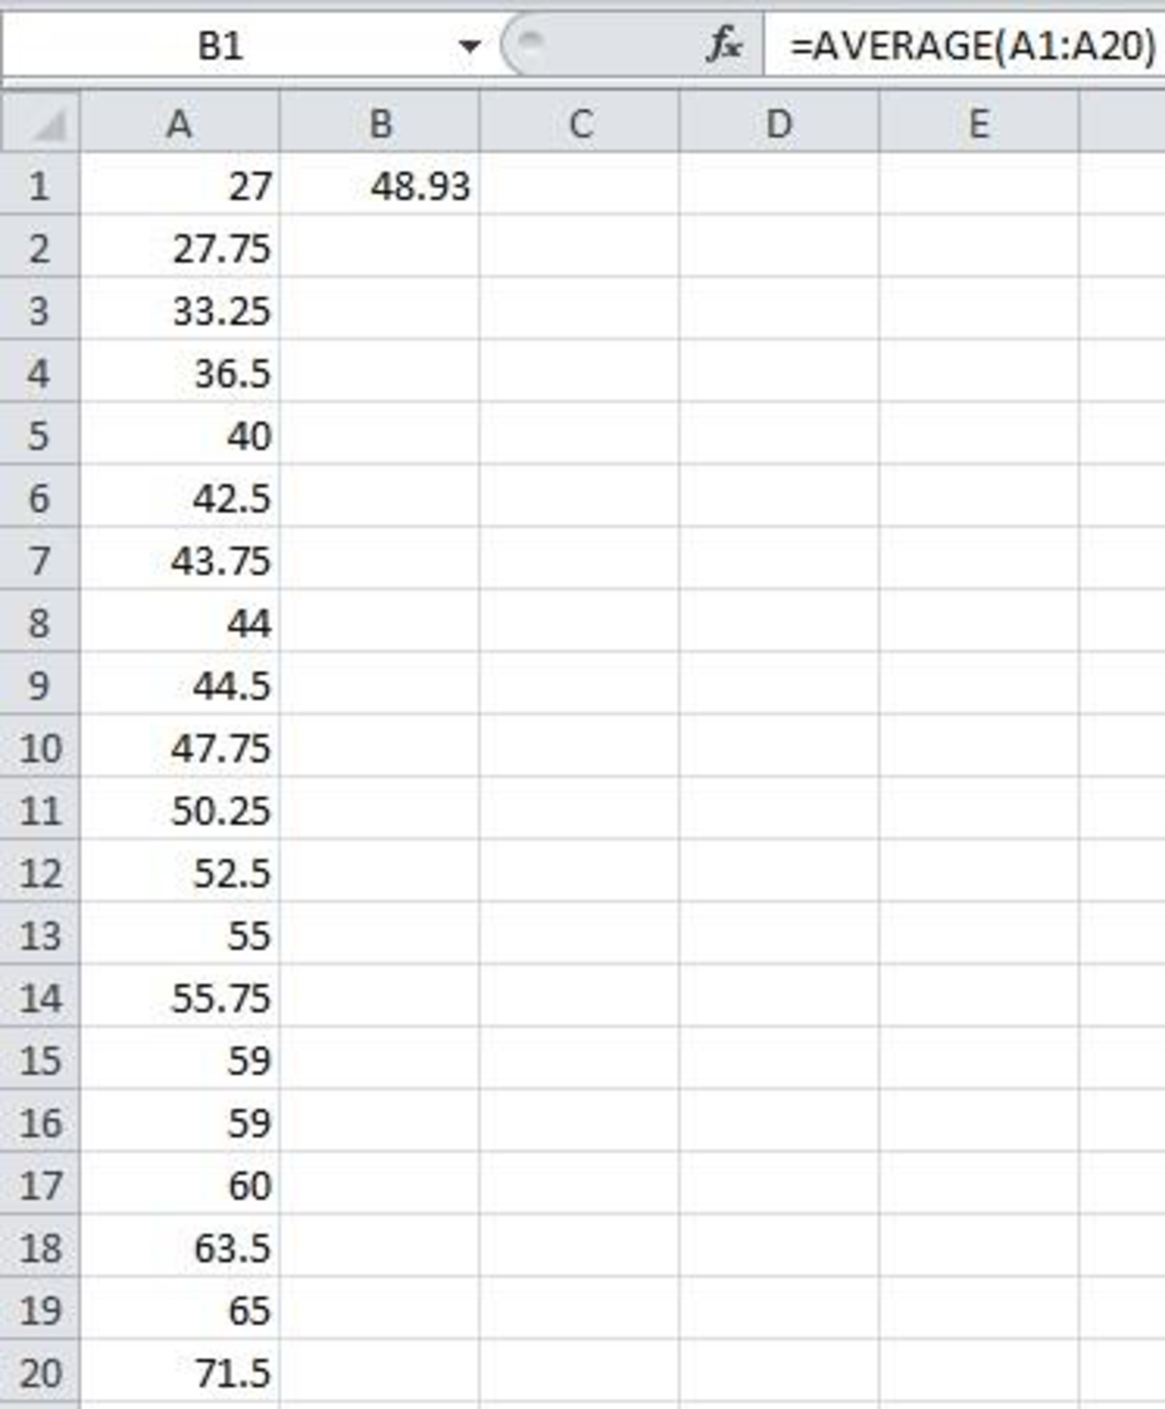
From the EXCEL output, the mean value is 48.93.

  • Since the sample size is large the mean of the 20 sample means is expected to have the population mean. Here, random numbers are generated from 0 to 99, by uniform distribution the mean value is 49.5(=b+a2). Thus, the obtained value of mean is close to the expected value.

g.

Expert Solution
Check Mark
To determine

Find the standard deviation of the 20 sample means and explain whether it was expected one or not.

Answer to Problem 94CE

  • The standard deviation of the 20 sample means is 12.41. The obtained value of mean is close to the expected value.

Explanation of Solution

Calculation:

Software procedure:

Step-by-step procedure to find the mean using the EXCEL software is given below:

  • • Open an EXCEL file.
  • • Enter the sample mean values from A1 through A20.
  • • In B1, enter the formula “=STDEV(A1:A20)”.
  • • Click Enter.
  • Output using EXCEL software is given below:

Applied Statistics in Business and Economics with Connect Access Card with LearnSmart, Chapter 8, Problem 94CE , additional homework tip  6

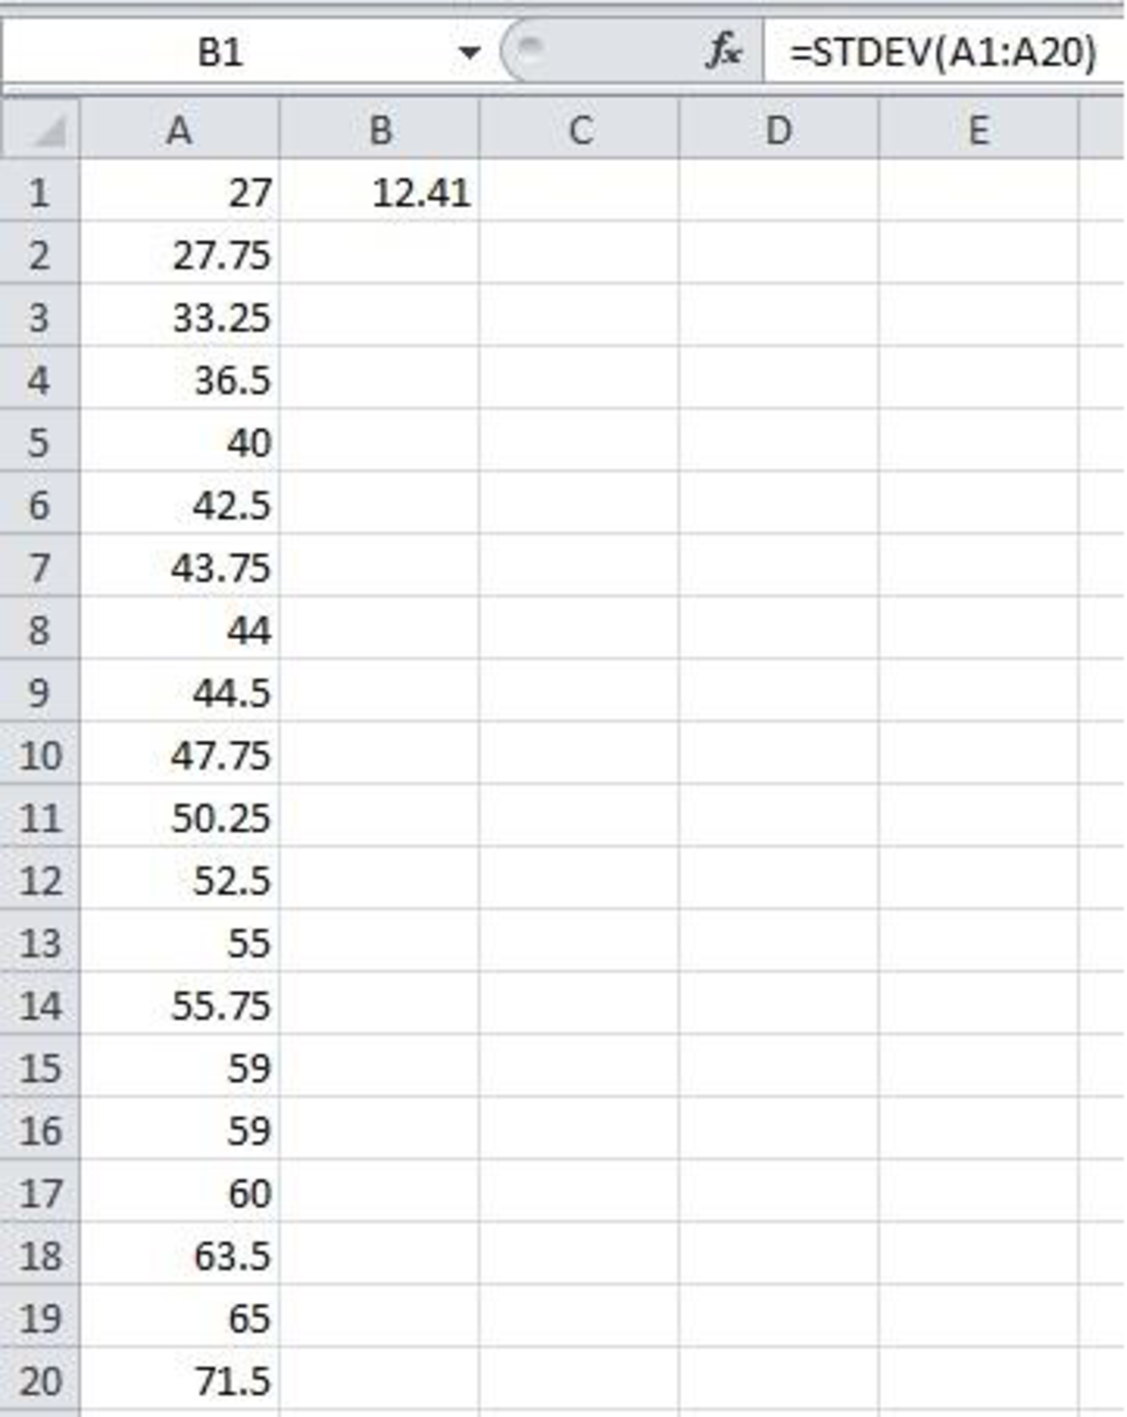
From the EXCEL output, the standard deviation is 12.41.

  • Since the sample size is large the standard deviation of the 20 sample means is expected to have thestandard deviation σx¯=σn. Here, random numbers are generated from 0 to 99, by uniform distribution the standard deviation value of population is 28.57(=ba12). The standard deviation of sample means is 14.285(=28.574).
  • Thus, the obtained standard deviation is close to the expected value.

Want to see more full solutions like this?

Subscribe now to access step-by-step solutions to millions of textbook problems written by subject matter experts!

Chapter 8 Solutions

Applied Statistics in Business and Economics with Connect Access Card with LearnSmart

Ch. 8.4 - Use the sample information x = 2.4, = 0.15, n = 9...Ch. 8.4 - Use the sample information x = 37, = 5, n = 15 to...Ch. 8.4 - A random sample of 25 items is drawn from a...Ch. 8.4 - A random sample of 100 items is drawn from a...Ch. 8.4 - The fuel economy of a 2011 Lexus RX 350 2WD 6...Ch. 8.4 - Guest ages at a Vail Resorts ski mountain...Ch. 8.4 - The Ball Corporations beverage can manufacturing...Ch. 8.5 - Find a confidence interval for assuming that each...Ch. 8.5 - For each value of d.f. (degrees of freedom), look...Ch. 8.5 - For each value of d.f. (degrees of freedom), look...Ch. 8.5 - A random sample of 10 items is drawn from a...Ch. 8.5 - A random sample of 25 items is drawn from a...Ch. 8.5 - A sample of 21 minivan electrical warranty repairs...Ch. 8.5 - A random sample of 16 pharmacy customers showed...Ch. 8.5 - A random sample of monthly rent paid by 12 college...Ch. 8.5 - A random sample of 10 shipments of stick-on labels...Ch. 8.5 - Prof. Green gave three exams last semester. Scores...Ch. 8.6 - Calculate the standard error of the sample...Ch. 8.6 - Calculate the standard error of the sample...Ch. 8.6 - Should p be assumed normal? a. n = 200, = .02 b....Ch. 8.6 - Should p be assumed normal? a. n = 25, =.50 b. n...Ch. 8.6 - Find the margin of error for a poll, assuming that...Ch. 8.6 - A car dealer is taking a customer satisfaction...Ch. 8.6 - In a sample of 500 new websites registered on the...Ch. 8.6 - From a list of stock mutual funds, 52 funds were...Ch. 8.6 - Of 43 bank customers depositing a check, 18...Ch. 8.6 - A survey showed that 4.8 percent of the 250...Ch. 8.7 - Calculate the FPCF for each sample and population...Ch. 8.7 - Use the following informationx=50, = 15, n = 90,...Ch. 8.7 - Use the following informationx=3.7, s = 0.2, n =...Ch. 8.7 - A random survey of 500 students was conducted from...Ch. 8.8 - For each level of precision, find the required...Ch. 8.8 - Last year, a study showed that the average ATM...Ch. 8.8 - The EPA city/hwy mpg range for a Saturn Vue FWD...Ch. 8.8 - Popcorn kernels are believed to take between 100...Ch. 8.8 - Analysis showed that the mean arrival rate for...Ch. 8.8 - Noodles Company wants to estimate the mean...Ch. 8.8 - In an intra-squad swim competition, mens freestyle...Ch. 8.8 - The city fuel economy of a 2009 Toyota 4Runner 2WD...Ch. 8.9 - What sample size would be required to estimate the...Ch. 8.9 - What sample size would be needed to estimate the...Ch. 8.9 - What sample size would be needed to estimate the...Ch. 8.9 - What sample size would be needed to estimate the...Ch. 8.9 - How large a sample size would be needed to...Ch. 8.9 - Inspection of a random sample of 19 aircraft...Ch. 8.10 - Find the 95 percent confidence interval for the...Ch. 8.10 - The weights of 20 oranges (in ounces) are shown...Ch. 8.10 - A pediatricians records showed the mean height of...Ch. 8.10 - Find the 90 percent confidence interval for the...Ch. 8 - Define (a) parameter, (b) estimator, (c) sampling...Ch. 8 - Explain the difference between sampling error and...Ch. 8 - Name three estimators. Which ones are unbiased?Ch. 8 - Explain what it means to say an estimator is (a)...Ch. 8 - State the main points of the Central Limit Theorem...Ch. 8 - Why is population shape of concern when estimating...Ch. 8 - (a) Define the standard error of the mean. (b)...Ch. 8 - Define (a) point estimate, (b) margin of error,...Ch. 8 - List some common confidence levels. What happens...Ch. 8 - List differences and similarities between Students...Ch. 8 - Give an example to show that (a) for a given...Ch. 8 - Why do outliers and skewed populations pose a...Ch. 8 - (a) State the Central Limit Theorem for a...Ch. 8 - (a) Define the standard error of the proportion....Ch. 8 - When would you use the FPCF and what does it do to...Ch. 8 - Prob. 16CRCh. 8 - When calculating a sample size for a proportion,...Ch. 8 - Why would we be interested in a confidence...Ch. 8 - A random sample of 30 lunch orders at Noodles ...Ch. 8 - A random sample of 21 nickels measured with a very...Ch. 8 - A random sample of 10 miniature Tootsie Rolls was...Ch. 8 - Statistics students were asked to go home and fill...Ch. 8 - A sample of 20 pages was taken without replacement...Ch. 8 - Twenty-five blood samples were selected by taking...Ch. 8 - A sample of 20 pages was taken from a Yellow Pages...Ch. 8 - Sixteen owners of 2010 Audi A4 sedans kept track...Ch. 8 - Twenty-five blood samples were selected by taking...Ch. 8 - Twenty-one warranty repairs were selected from a...Ch. 8 - Dave the jogger runs the same route every day...Ch. 8 - A pediatricians records showed the mean height of...Ch. 8 - A random sample of 10 exam scores showed a...Ch. 8 - A random sample of 30 lunch orders at Noodles ...Ch. 8 - During the Rose Bowl, the length (in seconds) of...Ch. 8 - A sample of 40 CDs from a student’s collection...Ch. 8 - The Environmental Protection Agency (EPA) requires...Ch. 8 - In a sample of 100 Planters Mixed Nuts, 19 were...Ch. 8 - A study showed that 14 of 180 publicly traded...Ch. 8 - How decaffeinated is decaffeinated coffee? If a...Ch. 8 - Noodles Company wants to estimate the percent of...Ch. 8 - Junior Achievement and Deloitte commissioned a...Ch. 8 - A random sample of 30 cans of Del Vino crushed...Ch. 8 - A poll of 125 college students who watch The Big...Ch. 8 - A survey of 4,581 U.S. households that owned a...Ch. 8 - A teen ethics poll was commissioned by Junior...Ch. 8 - Biting an unpopped kernel of popcorn hurts! As an...Ch. 8 - A sample of 213 newspaper tire ads from several...Ch. 8 - A physicians billing office conducted a random...Ch. 8 - Of 250 college students taking a statistics class,...Ch. 8 - (a) A poll of 2,277 likely voters was conducted on...Ch. 8 - To determine the proportion of taxpayers who...Ch. 8 - A sample of 40 CDs from a student’s collection...Ch. 8 - Vail Resorts would like to send a survey to their...Ch. 8 - This is an exercise using Excel. (a) Use...
Knowledge Booster
Background pattern image
Statistics
Learn more about
Need a deep-dive on the concept behind this application? Look no further. Learn more about this topic, statistics and related others by exploring similar questions and additional content below.
Recommended textbooks for you
Text book image
College Algebra (MindTap Course List)
Algebra
ISBN:9781305652231
Author:R. David Gustafson, Jeff Hughes
Publisher:Cengage Learning
Text book image
Holt Mcdougal Larson Pre-algebra: Student Edition...
Algebra
ISBN:9780547587776
Author:HOLT MCDOUGAL
Publisher:HOLT MCDOUGAL
Statistics 4.1 Point Estimators; Author: Dr. Jack L. Jackson II;https://www.youtube.com/watch?v=2MrI0J8XCEE;License: Standard YouTube License, CC-BY
Statistics 101: Point Estimators; Author: Brandon Foltz;https://www.youtube.com/watch?v=4v41z3HwLaM;License: Standard YouTube License, CC-BY
Central limit theorem; Author: 365 Data Science;https://www.youtube.com/watch?v=b5xQmk9veZ4;License: Standard YouTube License, CC-BY
Point Estimate Definition & Example; Author: Prof. Essa;https://www.youtube.com/watch?v=OTVwtvQmSn0;License: Standard Youtube License
Point Estimation; Author: Vamsidhar Ambatipudi;https://www.youtube.com/watch?v=flqhlM2bZWc;License: Standard Youtube License