
Videos
(a)
To calculate:The shape, center and the spread of the sampling distribution of
(a)
Answer to Problem 6E
The shape of sampling distribution of the sample mean
Explanation of Solution
Given information:
Number of trucks tested for NOX emission test is n = 50
Standard deviation
Formula Used:
Given, number of trucks tested for NOX emission test is n = 50
Standard deviation
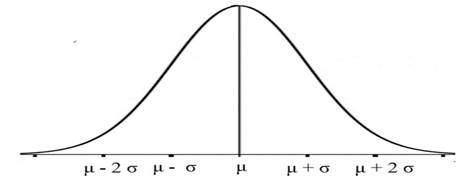
For the shape of the sampling distribution, use the Central Limit Theorem (CLT).
The shape of sampling distribution of the sample mean
For the center, from given information of the sampling distribution of the sample mean is
And for the spread, use the formula.
Hence, the shape is approximately normally distributed with center
(b)
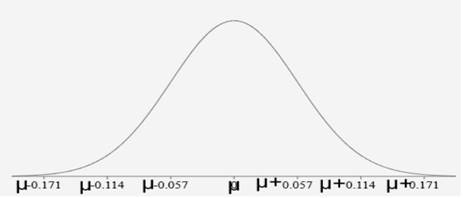
To draw:The sampling distribution of the mean and mark three standard deviation value on each side of the mean.
(b)
Explanation of Solution
Given information:
Number of trucks tested for NOX emission test is n = 50
Standard deviation
Given, number of trucks tested for NOX emission test is n = 50
Standard deviation
Below figure shows the sampling distribution of
(c)
Tocalculate: The distance m of the mean of the sampling distribution.
(c)
Answer to Problem 6E
Distance m of the mean of the sampling distribution is 0.114.
Explanation of Solution
Given information:
Number of trucks tested for NOX emission test is n = 50
Standard deviation
Given, number of trucks tested for NOX emission test is n = 50
Standard deviation
By 68-95-00.7% rule, about 95% of all values of
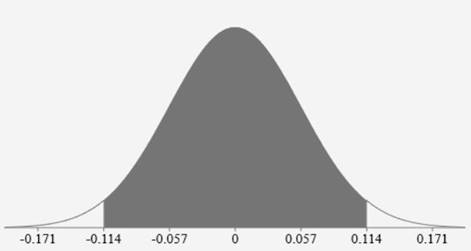
Hence, distance m of the mean of the sampling distribution is 0.114.
(d)
The percent captured
(d)
Answer to Problem 6E
Sample intervals capture 95% of
Explanation of Solution
Given information:
Number of trucks tested for NOX emission test is n = 50
Standard deviation
From 6c, 95% of all values of
Hence 95% of all possible sample capture
Chapter 8 Solutions
The Practice of Statistics for AP - 4th Edition
Additional Math Textbook Solutions
Elementary Statistics
Essentials of Statistics (6th Edition)
An Introduction to Mathematical Statistics and Its Applications (6th Edition)
Basic Business Statistics, Student Value Edition (13th Edition)
Essentials of Statistics, Books a la Carte Edition (5th Edition)


 MATLAB: An Introduction with ApplicationsStatisticsISBN:9781119256830Author:Amos GilatPublisher:John Wiley & Sons Inc
 Probability and Statistics for Engineering and th...StatisticsISBN:9781305251809Author:Jay L. DevorePublisher:Cengage Learning
 Statistics for The Behavioral Sciences (MindTap C...StatisticsISBN:9781305504912Author:Frederick J Gravetter, Larry B. WallnauPublisher:Cengage Learning
 Elementary Statistics: Picturing the World (7th E...StatisticsISBN:9780134683416Author:Ron Larson, Betsy FarberPublisher:PEARSON
 The Basic Practice of StatisticsStatisticsISBN:9781319042578Author:David S. Moore, William I. Notz, Michael A. FlignerPublisher:W. H. Freeman
 Introduction to the Practice of StatisticsStatisticsISBN:9781319013387Author:David S. Moore, George P. McCabe, Bruce A. CraigPublisher:W. H. Freeman