
Concept explainers
Videos
The graphs show the percentage of American adults in two living arrangements from 1960 through 2008.
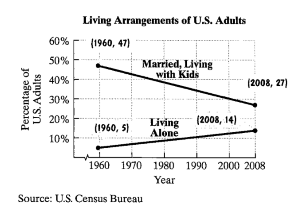
a. Write the slope-intercept equation of the line that models the percentage of U.S. adults living alone, y, x years after 1960. Round the value of the slope, m, to one decimal place.
b. Write the slope-intercept equation of the line that models the percentage of married U.S. adults living with kids, y, x years after 1960. Round the value of the slope, m, to one decimal place.
c. Use the models from parts (a) and (b) to project the year in which the percentage of adults living alone will be the same as the percentage of married adults living with kids. What percentage of U.S. adults will belong to each group during that year?
Want to see the full answer?
Check out a sample textbook solution
Chapter 8 Solutions
Algebra and Trigonometry - With Access (Looseleaf)


 Glencoe Algebra 1, Student Edition, 9780079039897...AlgebraISBN:9780079039897Author:CarterPublisher:McGraw Hill
 Holt Mcdougal Larson Pre-algebra: Student Edition...AlgebraISBN:9780547587776Author:HOLT MCDOUGALPublisher:HOLT MCDOUGAL
 Elementary AlgebraAlgebraISBN:9780998625713Author:Lynn Marecek, MaryAnne Anthony-SmithPublisher:OpenStax - Rice University