
Videos
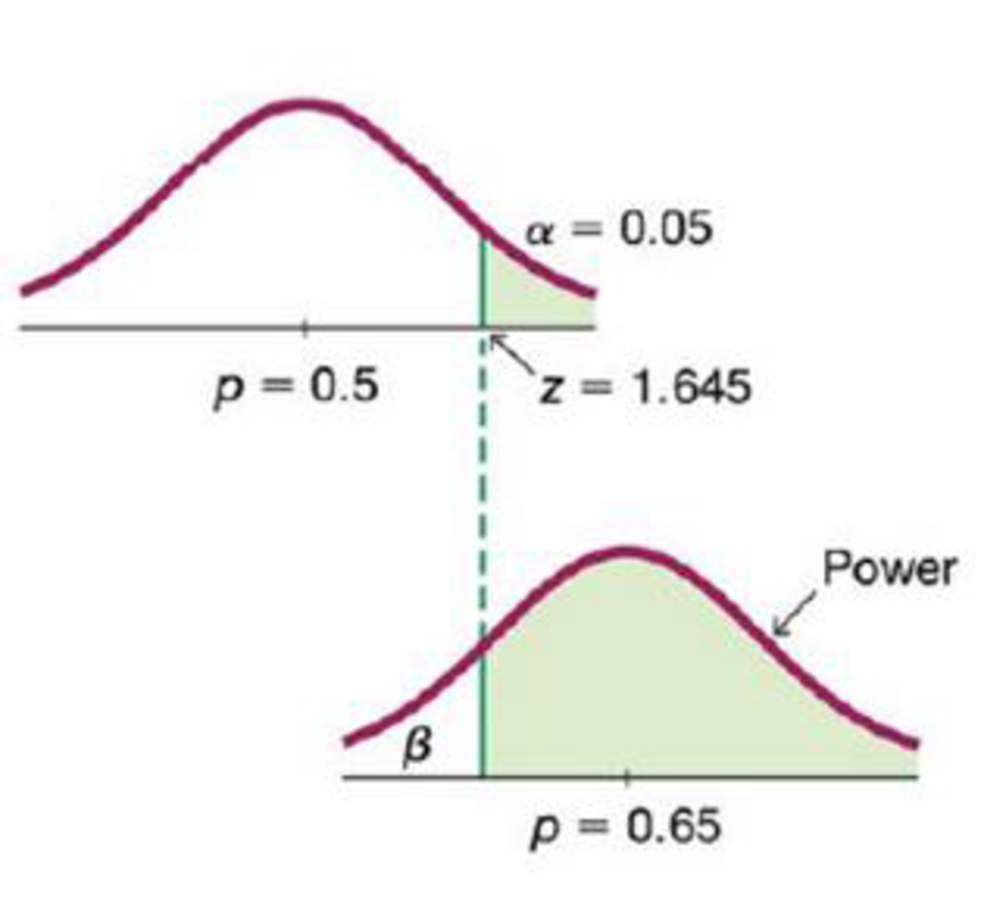
Calculating Power Consider a hypothesis test of the claim that the Ericsson method of gender selection is effective in increasing the likelihood of having a baby girl, so that the claim is p > 0.5. Assume that a significance level of α = 0.05 is used, and the sample is a simple random sample of size n = 64.
a. Assuming that the true population proportion is 0.65, find the power of the test, which is the probability of rejecting the null hypothesis when it is false. (Hint: With a 0.05 significance level, the critical value is z = 1.645, so any test statistic in the right tail of the accompanying top graph is in the rejection region where the claim is supported. Find the sample proportion p in the top graph, and use it to find the power shown in the bottom graph.)
b. Explain why the green-shaded region of the bottom graph represents the power of the test.
Want to see the full answer?
Check out a sample textbook solution
Chapter 8 Solutions
Elementary Statistics - With CD and Access


 Functions and Change: A Modeling Approach to Coll...AlgebraISBN:9781337111348Author:Bruce Crauder, Benny Evans, Alan NoellPublisher:Cengage Learning