
To find:
A 99% confidence interval for the mean
Answer to Problem 14E
Solution:
A 99% confidence interval for the mean face amount of an individual life insurance policy is in the interval,
Explanation of Solution
Approach:
Given a sample with standard deviation
The true population parameters probability lies in this interval range which is known as the confidence level
At a certain level of confidence, the interval in which the maximum error can be observed is known as the confidence interval.
Estimating parameters of a large population or a population following
The
The degrees of freedom is the attribute used to obtain the appropriate curve for the
The value of
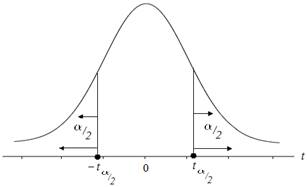
Hence this is a case of two-tailed t-distribution.
The maximum distance from point estimate that the confidence interval covers is margin of error and is given by:
Given the sample mean
Calculation:
The sample means is given by:
Substituting the values of life insurance policies in the formula above
| 150, 000 | 171758.62 | -21, 758.62 | 473437544.3 |
| 150, 000 | 171758.62 | -21, 758.62 | 473437544.3 |
| 150, 000 | 171758.62 | -21, 758.62 | 473437544.3 |
| 150, 000 | 171758.62 | -21, 758.62 | 473437544.3 |
| 150, 000 | 171758.62 | -21, 758.62 | 473437544.3 |
| 150, 000 | 171758.62 | -21, 758.62 | 473437544.3 |
| 151, 000 | 171758.62 | -20, 758.62 | 430920304.3 |
| 152, 000 | 171758.62 | -19, 758.62 | 390403064.3 |
| 152, 000 | 171758.62 | -19, 758.62 | 390403064.3 |
| 153, 000 | 171758.62 | -18, 758.62 | 351885824.3 |
| 153, 000 | 171758.62 | -18, 758.62 | 351885824.3 |
| 154, 000 | 171758.62 | -17, 758.62 | 315368584.3 |
| 155, 000 | 171758.62 | -16, 758.62 | 280851344.3 |
| 158, 000 | 171758.62 | -13, 758.62 | 189299624.3 |
| 158, 000 | 171758.62 | -12, 758.62 | 162782384.3 |
| 158, 000 | 171758.62 | -12, 758.62 | 162782384.3 |
| 160, 000 | 171758.62 | -11, 758.62 | 138265144.3 |
| 160, 000 | 171758.62 | -11, 758.62 | 138265144.3 |
| 160, 000 | 171758.62 | -11, 758.62 | 138265144.3 |
| 162, 000 | 171758.62 | -9, 758.62 | 95230664.3 |
| 163, 000 | 171758.62 | -8, 758.62 | 76713424.3 |
| 163, 000 | 171758.62 | -8, 758.62 | 76713424.3 |
| 163, 000 | 171758.62 | -8, 758.62 | 76713424.3 |
| 165, 000 | 171758.62 | -6, 758.62 | 45678944.3 |
| 165, 000 | 171758.62 | -6, 758.62 | 45678944.3 |
| 168, 000 | 171758.62 | -3, 758.62 | 14127224.3 |
| 168, 000 | 171758.62 | -3, 758.62 | 14127224.3 |
| 168, 000 | 171758.62 | -3, 758.62 | 14127224.3 |
| 171, 000 | 171758.62 | -758.62 | 575504.3044 |
| 171, 000 | 171758.62 | -758.62 | 575504.3044 |
| 172, 000 | 171758.62 | 241.38 | 58264.3044 |
| 172, 000 | 171758.62 | 241.38 | 58264.3044 |
| 172, 000 | 171758.62 | 241.38 | 58264.3044 |
| 173, 000 | 171758.62 | 1, 241.38 | 1541024.304 |
| 174, 000 | 171758.62 | 2, 241.38 | 5023784.304 |
| 175, 000 | 171758.62 | 3, 241.38 | 10506544.3 |
| 175, 000 | 171758.62 | 3, 241.38 | 10506544.3 |
| 175, 000 | 171758.62 | 3, 241.38 | 10506544.3 |
| 176, 000 | 171758.62 | 4, 241.38 | 17989304.3 |
| 182, 000 | 171758.62 | 10, 241.38 | 104885864.3 |
| 182, 000 | 171758.62 | 10, 241.38 | 104885864.3 |
| 183, 000 | 171758.62 | 11, 241.38 | 126368624.3 |
| 185, 000 | 171758.62 | 13, 241.38 | 175334144.3 |
| 185, 000 | 171758.62 | 13, 241.38 | 175334144.3 |
| 190, 000 | 171758.62 | 18, 241.38 | 332747944.3 |
| 190, 000 | 171758.62 | 18, 241.38 | 332747944.3 |
| 195, 000 | 171758.62 | 23, 241.38 | 540161744.3 |
| 195, 000 | 171758.62 | 23, 241.38 | 540161744.3 |
| 195, 000 | 171758.62 | 23, 241.38 | 540161744.3 |
| 196, 000 | 171758.62 | 24, 241.38 | 587644504.3 |
| 200, 000 | 171758.62 | 28, 241.38 | 797575544.3 |
| 200, 000 | 171758.62 | 28, 241.38 | 797575544.3 |
| 200, 000 | 171758.62 | 28, 241.38 | 797575544.3 |
| 200, 000 | 171758.62 | 28, 241.38 | 797575544.3 |
| 200, 000 | 171758.62 | 28, 241.38 | 797575544.3 |
| 202, 000 | 171758.62 | 30, 241.38 | 914541064.3 |
| 202, 000 | 171758.62 | 30, 241.38 | 914541064.3 |
| 163, 000 | 171758.62 | -8, 758.62 | 76713424.3 |
Form the above table we get,
Now the standard division is,
Level of confidence is 99%
Where
Critical t value at
Now substitute these values in margin of error.
Then, the margin of error is calculated as:
Then, interval is:
Conclusion:
A 95% confidence interval for the mean fastball pitching speed of all high school is in the interval
Want to see more full solutions like this?
Chapter 8 Solutions
Beginning Statistics

 MATLAB: An Introduction with ApplicationsStatisticsISBN:9781119256830Author:Amos GilatPublisher:John Wiley & Sons Inc
 Probability and Statistics for Engineering and th...StatisticsISBN:9781305251809Author:Jay L. DevorePublisher:Cengage Learning
 Statistics for The Behavioral Sciences (MindTap C...StatisticsISBN:9781305504912Author:Frederick J Gravetter, Larry B. WallnauPublisher:Cengage Learning
 Elementary Statistics: Picturing the World (7th E...StatisticsISBN:9780134683416Author:Ron Larson, Betsy FarberPublisher:PEARSON
 The Basic Practice of StatisticsStatisticsISBN:9781319042578Author:David S. Moore, William I. Notz, Michael A. FlignerPublisher:W. H. Freeman
 Introduction to the Practice of StatisticsStatisticsISBN:9781319013387Author:David S. Moore, George P. McCabe, Bruce A. CraigPublisher:W. H. Freeman