
Videos
Testing the Difference Between Two Means In Exercises 9–20, (a) identify the claim and state H0 and Ha, (b) find the critical value(s) and identify the rejection region(s), (c) calculate
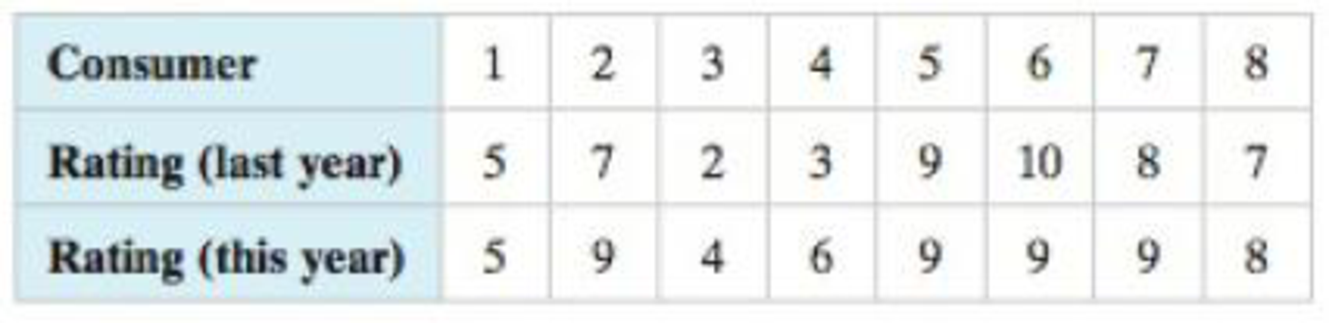
17. Product Ratings A company claims that its consumer product ratings (0–10) have changed from last year to this year. The table shows the company’s product ratings from the same eight consumers for last year and this year. At α = 0.05, is there enough evidence to support the company’s claim?
Want to see the full answer?
Check out a sample textbook solution
Chapter 8 Solutions
Elementary Statistics: Picturing the World (6th Edition)


- Testing Claims About Variation. In Exercises 5–16, test the given claim. Identify the null hypothesis, alternative hypothesis, test statistic, P-value, or critical value(s), then state the conclusion about the null hypothesis, as well as the final conclusion that addresses the original claim. Assume that a simple random sample is selected from a normally distributed population. Pulse Rates of Women Repeat the preceding exercise using the pulse rates of women listed in Data Set 1 “Body Data” in Appendix B. For the sample of pulse rates of women, n = 147 and s = 12.5. See the accompanying JMP display that results from using the original list of pulse rates instead of the summary statistics. (Hint: The bottom three rows of the display provide P -values for a two-tailed test, a left-tailed test, and a right-tailed test, respectively.) What do the results indicate about the effectiveness of using the range rule of thumb with the “normal range” from 60 to 100 beats per minute for estimating…arrow_forwardTesting Claims About Variation. In Exercises 5–16, test the given claim. Identify the null hypothesis, alternative hypothesis, test statistic, P-value, or critical value(s), then state the conclusion about the null hypothesis, as well as the final conclusion that addresses the original claim. Assume that a simple random sample is selected from a normally distributed population. Aircraft Altimeters The Skytek Avionics company uses a new production method to manufacture aircraft altimeters. A simple random sample of new altimeters resulted in the errors listed below. Use a 0.05 level of significance to test the claim that the new production method has errors with a standard deviation greater than 32.2 ft, which was the standard deviation for the old production method. If it appears that the standard deviation is greater, does the new production method appear to be better or worse than the old method? Should the company take any action?arrow_forwardTesting Hypotheses. In Exercises 13–24, assume that a simple random sample has been selected and test the given claim. Unless specified by your instructor, use either the P-value method or the critical value method for testing hypotheses. Identify the null and alternative hypotheses, test statistic, P-value (or range of P-values), or critical value(s), and state the final conclusion that addresses the original claim. Heights of Supermodels Listed below are the heights (cm) for the simple random sample of female supermodels Lima, Bundchen, Ambrosio, Ebanks, Iman, Rubik, Kurkova, Kerr, Kroes, Swanepoel, Prinsloo, Hosk, Kloss, Robinson, Heatherton, and Refaeli. Use a 0.01 significance level to test the claim that supermodels have heights with a mean that is greater than the mean height of 162 cm for women in the general population. Given that there are only 16 heights represented, can we really conclude that supermodels are taller than the typical woman?arrow_forward
- Testing Claims About Variation. In Exercises 5–16, test the given claim. Identify the null hypothesis, alternative hypothesis, test statistic, P-value, or critical value(s), then state the conclusion about the null hypothesis, as well as the final conclusion that addresses the original claim. Assume that a simple random sample is selected from a normally distributed population. Mint Specs Listed below are weights (grams) from a simple random sample of “wheat” pennies (from Data Set 29 “Coin Weights” in Appendix B). U.S. Mint specifications now require a standard deviation of 0.0230 g for weights of pennies. Use a 0.01 significance level to test the claim that wheat pennies are manufactured so that their weights have a standard deviation equal to 0.0230 g. Does the Mint specification appear to be met?arrow_forwardFinding Critical Values and Confidence Intervals. In Exercises 5–8, use the given information to find the number of degrees of freedom, the critical values χ2L and X2R, and the confidence interval estimate of σ. The samples are from Appendix B and it is reasonable to assume that a simple random sample has been selected from a population with a normal distribution. Nicotine in Menthol Cigarettes 95% confidence; n = 25, s = 0.24 mg White Blood Cell Counts of Men 95% confidence; n = 153, s = 1.86. Platelet Counts of Women 99% confidence; n = 147, s = 65.4. Heights of Men 99% confidence; n = 153, s = 7.10 cmarrow_forwardLarge Data Sets from Appendix B. In Exercises 17 and 18, use the data set from Appendix B to test the given claim. Identify the null hypothesis, alternative hypothesis, test statistic, P-value, or critical value(s), then state the conclusion about the null hypothesis, as well as the final conclusion that addresses the original claim. Fast Food Drive-Through Service Times Repeat Exercise 15 using the 50 service times for McDonald’s during dinner times in Data Set 25 “Fast Food.”arrow_forward
- Testing Claims About Variation. In Exercises 5–16, test the given claim. Identify the null hypothesis, alternative hypothesis, test statistic, P-value, or critical value(s), then state the conclusion about the null hypothesis, as well as the final conclusion that addresses the original claim. Assume that a simple random sample is selected from a normally distributed population. Coffee Vending Machines The Brazil vending machine dispenses coffee, and a random sample of 27 filled cups have contents with a mean of 7.14 oz and a standard deviation of 0.17 oz. Use a 0.05 significance level to test the claim that the machine dispenses amounts with a standard deviation greater than the standard deviation of 0.15 oz specified in the machine design.arrow_forwardLarge Data Sets from Appendix B. In Exercises 17 and 18, use the data set from Appendix B to test the given claim. Identify the null hypothesis, alternative hypothesis, test statistic, P-value, or critical value(s), then state the conclusion about the null hypothesis, as well as the final conclusion that addresses the original claim. Mint Specs Repeat Exercise 16 using the weights of the 37 post-1983 pennies included in Data Set 29 “Coin Weights” in Appendix B.arrow_forwardTesting Claims About Proportions. In Exercises 7–22, test the given claim. Identify the null hypothesis, alternative hypothesis, test statistic, P-value or critical value(s), then state the conclusion about the null hypothesis, as well as the final conclusion that addresses the original claim. Does Aspirin Prevent Heart Disease? In a trial designed to test the effectiveness of aspirin in preventing heart disease, 11,037 male physicians were treated with aspirin and 11,034 male physicians were given placebos. Among the subjects in the aspirin treatment group, 139 experienced myocardial infarctions (heart attacks). Among the subjects given placebos, 239 experienced myocardial infarctions (based on data from “Final Report on the Aspirin Component of the Ongoing Physicians’ Health Study,” New England Journal of Medicine , Vol. 321: 129–135). Use a 0.05 significance level to test the claim that aspirin has no effect on myocardial infarctions. a. Test the claim using a hypothesis test. b.…arrow_forward
- Testing Claims About Variation. In Exercises 5–16, test the given claim. Identify the null hypothesis, alternative hypothesis, test statistic, P-value, or critical value(s), then state the conclusion about the null hypothesis, as well as the final conclusion that addresses the original claim. Assume that a simple random sample is selected from a normally distributed population. Body Temperature Example 5 in Section 8-3 involved a test of the claim that humans have body temperatures with a mean equal to 98.6°F. The sample of 106 body temperatures has a standard deviation of 0.62°F. The conclusion in that example would change if the sample standard deviation s were 2.08°F or greater. Use a 0.01 significance level to test the claim that the sample of 106 body temperatures is from a population with a standard deviation less than 2.08°F. What does the result tell us about the validity of the hypothesis test in Example 5 in Section 8-3?arrow_forwardTesting Claims About Variation. In Exercises 5–16, test the given claim. Identify the null hypothesis, alternative hypothesis, test statistic, P-value, or critical value(s), then state the conclusion about the null hypothesis, as well as the final conclusion that addresses the original claim. Assume that a simple random sample is selected from a normally distributed population. Spoken Words Couples were recruited for a study of how many words people speak in a day. A random sample of 56 males resulted in a mean of 16,576 words and a standard deviation of 7871 words. Use a 0.01 significance level to test the claim that males have a standard deviation that is greater than the standard deviation of 7460 words for females (based on Data Set 24 “Word Counts”).arrow_forwardTesting Claims About Variation. In Exercises 5–16, test the given claim. Identify the null hypothesis, alternative hypothesis, test statistic, P-value, or critical value(s), then state the conclusion about the null hypothesis, as well as the final conclusion that addresses the original claim. Assume that a simple random sample is selected from a normally distributed population. Birth Weights A simple random sample of birth weights of 30 girls has a standard deviation of 829.5 hg. Use a 0.01 significance level to test the claim that birth weights of girls have the same standard deviation as birth weights of boys, which is 660.2 hg (based on Data Set 4 “Births” in Appendix B).arrow_forward
 Functions and Change: A Modeling Approach to Coll...AlgebraISBN:9781337111348Author:Bruce Crauder, Benny Evans, Alan NoellPublisher:Cengage Learning