
Concept explainers
Videos
a.
Compute the sample proportion
a.
Answer to Problem 11E
The value of sample proportion
Explanation of Solution
In a simple random sample, of 75 samples, only 42 individuals are in the group of interest.
The sample proportion
Where, x be the number of observations, n be the sample size.
Substitute the corresponding values to get the proportion,
Thus, the sample proportion
b.
Check whether the assumptions for the hypothesis test are satisfied.
b.
Answer to Problem 11E
Yes, the assumptions for the hypothesis test are satisfied.
Explanation of Solution
Assumptions for performing a hypothesis test for a population proportion:
- The samples taken from the population are simple random samples.
- The population is at least 20 times as large as samples.
- The samples in the population are divided into two categories.
- The values of
Requirement check:
- The sample of 75 is simple random samples.
- However, the information about the population is not known. The population size is assumed to be more than 20 times as large as the sample.
- The samples in the population seemed to be categorized into two parts. That is, individuals under category of interest and individuals not under the category of interest.
- Verify the condition:
Substitute n as 75and
Substitute n as 75 and
Therefore, all the conditions are satisfied.
c.
Find the value of test statistic.
c.
Answer to Problem 11E
The value of test statistic is –0.71.
Explanation of Solution
Calculation:
Denote p as the true population proportion.
The given test hypotheses are:
Null hypothesis:
That is, the true proportion of the individuals under the category of interest is 0.6.
Alternate hypothesis:
That is, the true proportion of the individuals under the category of interest is different from 0.6.
Test statistic:
The z-test statistic is:
Where,
Software procedure:
Step by step procedure to find the test statistic using the MINITAB software:
- Choose Stat > Basic Statistics > 1-Proportion.
- In Number of trials, enter the Sample size as 75 and in Number of
Events , Enter Number of observations as 42. - Enter Hypothesized proportion as 0.6.
- Select Options.
- Choose
- Click OK in all dialogue boxes.
The output using Minitab is given below:
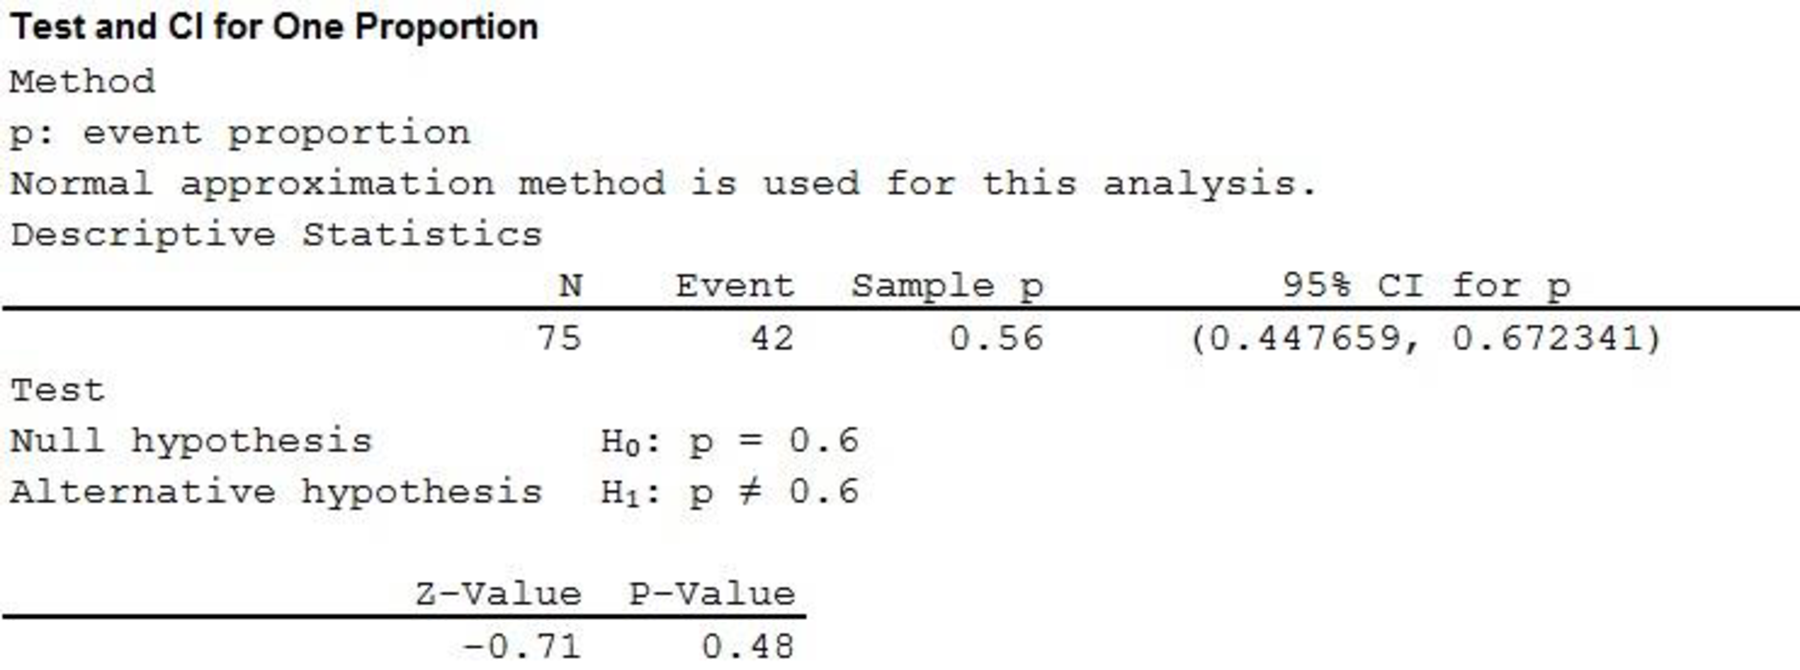
From the MINITAB output, the test statistic, that is, the z-value is –0.71.
Thus, the value of test statistic z is –0.71.
d.
Decide whether the null hypothesis
d.
Answer to Problem 11E
The null hypothesis
Explanation of Solution
From previous part (c), it has been found that the value of test statistic z is –0.71.
From the given hypothesis, the alternative hypothesis contains the not equal
From Table 8.1 “Table of Critical Values”, the critical value for two-tailed test at
Therefore, the critical region is
Decision based on the critical value method:
For left-tailed test: If
For right-tailed test: If
For two-tailed test: If
Conclusion:
The critical value at
Here, the test statistic value of –0.71 lies within the critical region of
That is,
Therefore, the null hypothesis is not rejected.
Hence, there is no evidence that the true proportion of the individuals under the category of interest is 0.6.
Want to see more full solutions like this?
Chapter 8 Solutions
ESSENTIAL STATISTICS(FD)


- The means of the two random samples of 1000 and 2000 are 67.5 and 68.0 inches respectively. Can the samples be regarded to have been drawn from the same population of standard deviation 9.5 inches? Test at 5% level of significance. Also write objective, null and alternate hypothesis.arrow_forwardOnly 15% of registered voters voted in the last election. Will voter participation increase for the upcoming election? Of the 363 randomly selected registered voters surveyed, 58 of them will vote in the upcoming election. What can be concluded at the αα = 0.01 level of significance? For this study, we should use Select an answer t-test for a population mean z-test for a population proportion The null and alternative hypotheses would be: H0:H0: ? μ p Select an answer > < ≠ = (please enter a decimal) H1:H1: ? μ p Select an answer = < ≠ > (Please enter a decimal) The test statistic ? t z = (please show your answer to 3 decimal places.) The p-value = (Please show your answer to 4 decimal places.) The p-value is ? > ≤ αα Based on this, we should Select an answer accept reject fail to reject the null hypothesis. Thus, the final conclusion is that ... The data suggest the population proportion is not significantly higher than 15% at αα = 0.01, so there…arrow_forwardOnly 18% of registered voters voted in the last election. Will voter participation decline for the upcoming election? Of the 362 randomly selected registered voters surveyed, 62 of them will vote in the upcoming election. What can be concluded at the αα = 0.05 level of significance? For this study, we should use Select an answer t-test for a population mean z-test for a population proportion Correct The null and alternative hypotheses would be: H0:H0: ? p μ Correct Select an answer ≠ < > = Correct (please enter a decimal) H1:H1: ? p μ Correct Select an answer > = < ≠ Correct (Please enter a decimal) The test statistic ? t z Correct = (please show your answer to 3 decimal places.) The p-value = (Please show your answer to 4 decimal places.)arrow_forward
- Only 16% of registered voters voted in the last election. Will voter participation increase for the upcoming election? Of the 328 randomly selected registered voters surveyed, 66 of them will vote in the upcoming election. What can be concluded at the αα = 0.05 level of significance? For this study, we should use Select an answer t-test for a population mean z-test for a population proportion The null and alternative hypotheses would be: H0:H0: ? μ p Select an answer < = > ≠ (please enter a decimal) H1:H1: ? p μ Select an answer = ≠ > < (Please enter a decimal) The test statistic ? t z = (please show your answer to 3 decimal places.) The p-value = (Please show your answer to 4 decimal places.) The p-value is ? ≤ > αα Based on this, we should Select an answer fail to reject reject accept the null hypothesis. Thus, the final conclusion is that ... The data suggest the population proportion is not significantly higher than 16% at αα = 0.05, so…arrow_forwardRecently, a large academic medical center determined that 10 of 22 employees in a particular position were male, whereas 51% of the employees for this position in the general workforce were male. At the 0.01 level of significance, is there evidence that the proportion of males in this position at this medical center is different from what would be expected in the general workforce? 1) What are the correct hypotheses to test to determine if the proportion is different? 2) Calculate the test statistic 3) What is the p-value State the conclusion of the test.arrow_forwardOnly 18% of registered voters voted in the last election. Will voter participation decline for the upcoming election? Of the 329 randomly selected registered voters surveyed, 43 of them will vote in the upcoming election. What can be concluded at the αα = 0.10 level of significance? For this study, we should use Select an answer t-test for a population mean z-test for a population proportion The null and alternative hypotheses would be: H0:H0: ? p μ Select an answer > < ≠ = (please enter a decimal) H1:H1: ? p μ Select an answer = < ≠ > (Please enter a decimal) The test statistic ? t z = (please show your answer to 3 decimal places.) The p-value = (Please show your answer to 4 decimal places.) The p-value is ? ≤ > αα Based on this, we should Select an answer accept reject fail to reject the null hypothesis. Thus, the final conclusion is that ... The data suggest the population proportion is not significantly lower than 18% at αα = 0.10, so…arrow_forward
- Only 12% of registered voters voted in the last election. Will voter participation increase for the upcoming election? Of the 351 randomly selected registered voters surveyed, 53 of them will vote in the upcoming election. What can be concluded at the αα = 0.01 level of significance? For this study, we should use Select an answer z-test for a population proportion t-test for a population mean The null and alternative hypotheses would be: H0:H0: ? μ p Select an answer ≠ > = < (please enter a decimal) H1:H1: ? μ p Select an answer > ≠ < = (Please enter a decimal) The test statistic ? z t = (please show your answer to 3 decimal places.) The p-value = (Please show your answer to 4 decimal places.) The p-value is ? > ≤ αα Based on this, we should Select an answer reject accept fail to reject the null hypothesis. Thus, the final conclusion is thatarrow_forwardA manufacturer must test that his bolts are 4.00cm long when they come off the assembly line. He must recalibrate his machines if the bolts are too long or too short. After sampling 169 randomly selected bolts off the assembly line, he calculates the sample mean to be 4.07cm. He knows that the population standard deviation is 0.45cm. Assuming a level of significance of 0.02, is there sufficient evidence to show that the manufacturer needs to recalibrate the machines?arrow_forwardOnly 11% of registered voters voted in the last election. Will voter participation increase for the upcoming election? Of the 369 randomly selected registered voters surveyed, 59 of them will vote in the upcoming election. What can be concluded at the αα = 0.05 level of significance? For this study, we should use T test population for mean or Z test for a population proportion The null and alternative hypotheses would be: H0:H0: p or u, <,>,= (please enter a decimal) H1:H1: p or u, <,>,= (Please enter a decimal) The test statistic Z or T = (please show your answer to 3 decimal places.) The p-value = (Please show your answer to 4 decimal places.) The p-value is <,> αα Based on this, we should fail to reject, reject, or accept the null hypothesis. Thus, the final conclusion is that ... The data suggest the population proportion is not significantly higher than 11% at αα = 0.05, so there is statistically…arrow_forward
- Only 19% of registered voters voted in the last election. Will voter participation change for the upcoming election? Of the 328 randomly selected registered voters surveyed, 49 of them will vote in the upcoming election. What can be concluded at the αα = 0.01 level of significance? a. For this study, we should use Select an answer z-test for a population proportion t-test for a population mean b. The null and alternative hypotheses would be: H0:H0: ? μ p Select an answer > < = ≠ (please enter a decimal) H1:H1: ? μ p Select an answer < ≠ = > (Please enter a decimal) c. The test statistic ? t z = (please show your answer to 3 decimal places.) d. The p-value = (Please show your answer to 4 decimal places.) e. The p-value is ? ≤ > αα f. Based on this, we should Select an answer accept fail to reject reject the null hypothesis. g. Thus, the final conclusion is that ... The data suggest the population proportion is not significantly different…arrow_forwardOnly 19% of registered voters voted in the last election. Will voter participation change for the upcoming election? Of the 328 randomly selected registered voters surveyed, 49 of them will vote in the upcoming election. What can be concluded at the αα = 0.01 level of significance? a. For this study, we should use Select an answer z-test for a population proportion t-test for a population mean b. The null and alternative hypotheses would be: H0:H0: ? μ p Select an answer > < = ≠ (please enter a decimal) H1:H1: ? μ p Select an answer < ≠ = > (Please enter a decimal) c. The test statistic ? t z = (please show your answer to 3 decimal places.) d. The p-value = (Please show your answer to 4 decimal places.) e. The p-value is ? ≤ > αα f. Based on this, we should Select an answer accept fail to reject reject the null hypothesis. g. Thus, the final conclusion is that ... The data suggest the population proportion is not significantly different…arrow_forwardAccording to a survey, the average American person is in a car for 5 hours per week. To test if the amount of car time in Los Angeles is less than the national average, a researcher decides to do a hypothesis test, at a 10% significance level. She surveys 15 Los Angeleans randomly and asks them about their amount of time in a car each week, on average. From the data, the sample mean time is 4.3 hours per week, and the sample standard deviation (s) is 0.7 hours. H0: μ≤5; Ha: μ>5. α=0.1 (significance level) What is the test statistic (t-value) of this one-mean hypothesis test (with σ unknown)? Round your final answer to two decimal places.arrow_forward
 MATLAB: An Introduction with ApplicationsStatisticsISBN:9781119256830Author:Amos GilatPublisher:John Wiley & Sons Inc
 Probability and Statistics for Engineering and th...StatisticsISBN:9781305251809Author:Jay L. DevorePublisher:Cengage Learning
 Statistics for The Behavioral Sciences (MindTap C...StatisticsISBN:9781305504912Author:Frederick J Gravetter, Larry B. WallnauPublisher:Cengage Learning
 Elementary Statistics: Picturing the World (7th E...StatisticsISBN:9780134683416Author:Ron Larson, Betsy FarberPublisher:PEARSON
 The Basic Practice of StatisticsStatisticsISBN:9781319042578Author:David S. Moore, William I. Notz, Michael A. FlignerPublisher:W. H. Freeman
 Introduction to the Practice of StatisticsStatisticsISBN:9781319013387Author:David S. Moore, George P. McCabe, Bruce A. CraigPublisher:W. H. Freeman