
Concept explainers
Videos
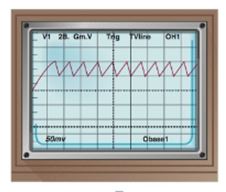
The Sawtooth Curve An oscilloscope often displays a sawtooth curve. This curve can be approximated by sinusoidal curves of varying periods and amplitudes.
(a) Use a graphing utility to graph the following function, which can be used to approximate the sawtooth curve.(a) Use a graphing utility to graph the following function, which can be used to approximate the sawtooth curve.
(b) A better approximation to the sawtooth curve is given by
Use a graphing utility to graph this function for and compare the result to the graph obtained in part (a).
(c) A third and even better approximation to the sawtooth curve is given by
Use a graphing utility to graph this function for and compare the result t
Want to see the full answer?
Check out a sample textbook solution
Chapter 8 Solutions
Precalculus
Additional Math Textbook Solutions
Calculus, Single Variable: Early Transcendentals (3rd Edition)
University Calculus: Early Transcendentals (4th Edition)
Glencoe Math Accelerated, Student Edition
Precalculus: Concepts Through Functions, A Unit Circle Approach to Trigonometry (4th Edition)
Single Variable Calculus: Early Transcendentals (2nd Edition) - Standalone book


- Vibrating String When a violin string vibrates, the sound produced results from a combination of standing waves that have evenly placed nodes. The figure (1) illustrates some of the possible standing waves. Lets assume that the string has length . a.For fixed t, the string has the shape of a sine curve y=Asinx. Find the appropriate value of for each of the illustrated standing waves. b.Do you notice a pattern in the values of that you found in part a? What would the next two values of be? Sketch rough graphs of the standing waves associated with these new values of . c.Suppose that for fixed t, each point on the string that is not a node vibrates with frequency 440Hz. Find the value of for which an equation of the form y=Acost would model this motion. d.Combine your answers for parts a and c to find functions of the form y(x,t)=Asinxcost that model each of the standing waves in the figure. Assume that A=1. Figure (1)arrow_forwardBlood Pressure The pressure P (in millimeters of mercury) against the walls of the blood vessels of a patient is modeled by P=10020cos8t3 where t is the time (in seconds). (a) Use a graphing utility to graph the model. (b) What is the period of the model? What does it represent in the context of the problem? (c) What is the amplitude of the model? What does it represent in the context of the problem? (d) If one cycle of this model is equivalent to one heartbeat, what is the pulse of the patient? (e) A physician wants the patient’s pulse rate to be 64 beats per minute or less. What should the period be? What should the coefficient of t be?arrow_forwardHyperbolic sine Function The hyperbolic sine function is defined by sinh(x)=exex2 a Sketch the graph of this function using graphical addition as in Exercise 17. b Use the definition to show that sinh(x)=sinh(x) Hyperbolic Cosine Function The hyperbolic cosine function is defined by cosh(x)=ex+ex2 a Sketch the graphs of the functions y=13ex and y=12ex on the same axes, and use graphical addition see Section 2.7 to sketch the graph of y=cosh(x). b Use the definition to show that cosh(x)=cosh(x).arrow_forward
 Trigonometry (MindTap Course List)TrigonometryISBN:9781337278461Author:Ron LarsonPublisher:Cengage Learning
 Trigonometry (MindTap Course List)TrigonometryISBN:9781305652224Author:Charles P. McKeague, Mark D. TurnerPublisher:Cengage Learning
 Algebra and Trigonometry (MindTap Course List)AlgebraISBN:9781305071742Author:James Stewart, Lothar Redlin, Saleem WatsonPublisher:Cengage Learning
 Algebra & Trigonometry with Analytic GeometryAlgebraISBN:9781133382119Author:SwokowskiPublisher:Cengage