
Concept explainers
Videos
To calculate: To find which statement best describes the relationship shown on the scatter plot
Answer to Problem 13STP
The amount of money in circulation per person increased over time
Explanation of Solution
Given information: Scatter plot showing how much money is in circulation per person in the Unites States in different years

Formula Used:
Equation of line passing through two points is given as
Calculation:
Scatter plot is given as follows:
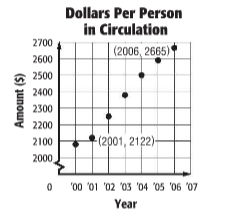
Points on the line from graph are as follows:
Equation of line passing through the above points is calculated as follows:
By comparing the above equation with slope intercept form of line,
Since slope is positive, this means that amount of money in circulation per person increased over time
Conclusion:
Hence, the statement that best describes the relationship is “The amount of money in circulation per person increased over time”
Chapter 8 Solutions
Pre-Algebra, Student Edition
Additional Math Textbook Solutions
Elementary Algebra
Intermediate Algebra (7th Edition)
College Algebra
A Graphical Approach to College Algebra (6th Edition)
College Algebra (6th Edition)


 Algebra and Trigonometry (6th Edition)AlgebraISBN:9780134463216Author:Robert F. BlitzerPublisher:PEARSON
 Contemporary Abstract AlgebraAlgebraISBN:9781305657960Author:Joseph GallianPublisher:Cengage Learning
 Linear Algebra: A Modern IntroductionAlgebraISBN:9781285463247Author:David PoolePublisher:Cengage Learning
 Algebra And Trigonometry (11th Edition)AlgebraISBN:9780135163078Author:Michael SullivanPublisher:PEARSON
 Introduction to Linear Algebra, Fifth EditionAlgebraISBN:9780980232776Author:Gilbert StrangPublisher:Wellesley-Cambridge Press
 College Algebra (Collegiate Math)AlgebraISBN:9780077836344Author:Julie Miller, Donna GerkenPublisher:McGraw-Hill Education