
Videos
a.
Find the value of
a.
Answer to Problem 107CE
The
| True mean | |
| 495 | 0.7915 |
| 490 | 0.4913 |
| 485 | 0.1962 |
| 480 | 0.0457 |
Explanation of Solution
Calculation:
The given information is that the sample of size 4 are considered. The know standard deviation is 12. Here, the researcher interested to test the hypothesis that
The test hypotheses are given below:
Null hypothesis:
Alternative hypothesis:
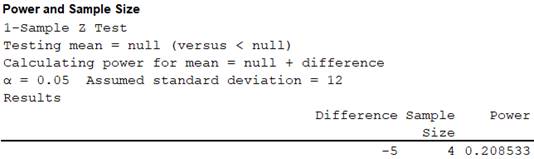
If the true mean is 495, the value of
Software procedure:
Step-by-step software procedure to obtain power using MINITAB is as follows:
- Select Stat > Power and sample size > 1 sample z.
- Enter
Sample sizes as 4, Differences as –5, and Standard deviation as 12. - Click OK.
- Output using MINITAB software is given below:
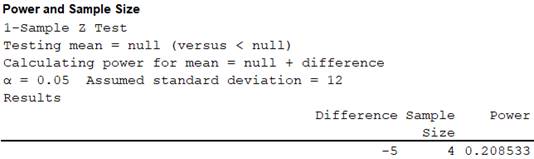
From the output, the power is 0.2085.
The value of
Thus, the value of
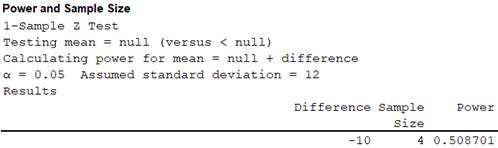
If the true mean is 490, the value of
Software procedure:
Step-by-step software procedure to obtain power using MINITAB is as follows:
- Select Stat > Power and sample size > 1 sample z.
- Enter Sample sizes as 4, Differences as –10, and Standard deviation as 12.
- Click OK.
- Output using MINITAB software is given below:
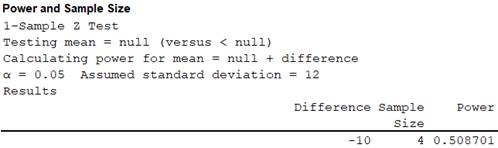
From the output, the power is 0.5087.
The value of
Thus, the value of
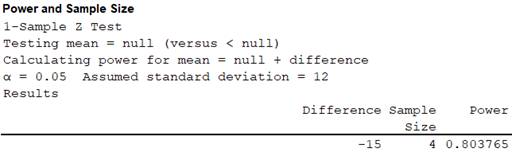
If the true mean is 485, the value of
Software procedure:
Step-by-step software procedure to obtain power using MINITAB is as follows:
- Select Stat > Power and sample size > 1 sample z.
- Enter Sample sizes as 4, Differences as –15, and Standard deviation as 12.
- Click OK.
- Output using MINITAB software is given below:
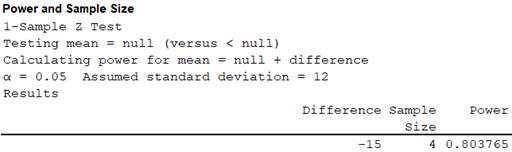
From the output, the power is 0.8038.
The value of
Thus, the value of
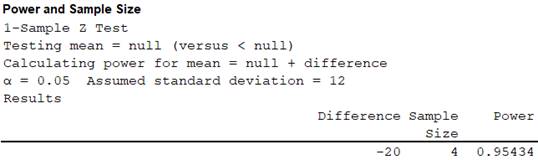
If the true mean is 480, the value of
Software procedure:
Step-by-step software procedure to obtain power using MINITAB is as follows:
- Select Stat > Power and sample size > 1 sample z.
- Enter Sample sizes as 4, Differences as –20, and Standard deviation as 12.
- Click OK.
- Output using MINITAB software is given below:
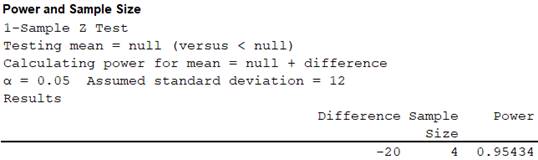
From the output, the power is 0.9543.
The value of
Thus, the value of
b.
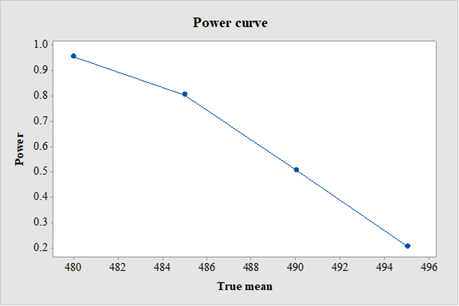
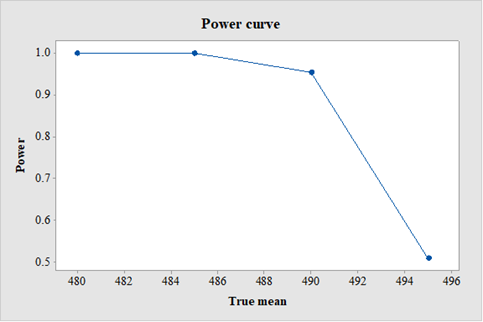
Find the power if the true means are 495, 490, 485 and 480 and sketch the power curve.
b.
Answer to Problem 107CE
The power values are tabulated below:
| True mean | Power |
| 495 | 0.2085 |
| 490 | 0.5087 |
| 485 | 0.8038 |
| 480 | 0.9543 |
- Output using MINITAB software is given below:
Explanation of Solution
Calculation:
If the true mean is 495, the power is calculated as follows:
Software procedure:
Step-by-step software procedure to obtain power using MINITAB is as follows:
- Select Stat > Power and sample size > 1 sample z.
- Enter Sample sizes as 4, Differences as –5, and Standard deviation as 12.
- Click OK.
- Output using MINITAB software is given below:
From the output, the power is 0.2085.
If the true mean is 490, the power is calculated as follows:
Software procedure:
Step-by-step software procedure to obtain power using MINITAB is as follows:
- Select Stat > Power and sample size > 1 sample z.
- Enter Sample sizes as 4, Differences as –10, and Standard deviation as 12.
- Click OK.
- Output using MINITAB software is given below:
From the output, the power is 0.5087.
If the true mean is 485, the power is calculated as follows:
Software procedure:
Step-by-step software procedure to obtain power using MINITAB is as follows:
- Select Stat > Power and sample size > 1 sample z.
- Enter Sample sizes as 4, Differences as –15, and Standard deviation as 12.
- Click OK.
- Output using MINITAB software is given below:
From the output, the power is 0.8038.
If the true mean is 480, the power is calculated as follows:
Software procedure:
Step-by-step software procedure to obtain power using MINITAB is as follows:
- Select Stat > Power and sample size > 1 sample z.
- Enter Sample sizes as 4, Differences as –20, and Standard deviation as 12.
- Click OK.
- Output using MINITAB software is given below:
From the output, the power is 0.9543.
Sketch the power curve.
Software procedure:
Step-by-step software procedure to construct the power curve using MINITAB is as follows:
- Choose Graph >
Scatterplot . - Choose With Connect Line, and then click OK.
- Under Y variables, enter Power.
- Under X variables, enter True mean.
- Click OK.
c.
Find the
c.
Answer to Problem 107CE
The
| True mean | Power | |
| 495 | 0.5087 | 0.4913 |
| 490 | 0.9543 | 0.0457 |
| 485 | 0.9996 | 0.0004 |
| 480 | 1 | 0 |
- Output using MINITAB software is given below:
Explanation of Solution
Calculation:
The given information is that the sample of size 16 are considered. The know standard deviation is 12. Here, the researcher interested to test the hypothesis that
The true means are 495, 490, 485 and 480.
If the true mean is 495, the
Software procedure:
Step-by-step software procedure to obtain power using MINITAB is as follows:
- Select Stat > Power and sample size > 1 sample z.
- Enter Sample sizes as 16, Differences as –5, and Standard deviation as 12.
- Click OK.
- Output using MINITAB software is given below:
From the output, the power is 0.5087.
The value of
Thus, the value of
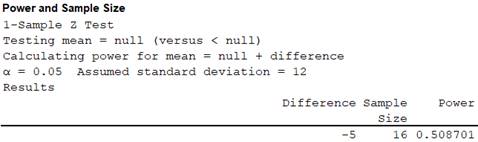
If the true mean is 490, the
Software procedure:
Step-by-step software procedure to obtain power using MINITAB is as follows:
- Select Stat > Power and sample size > 1 sample z.
- Enter Sample sizes as 16, Differences as –10, and Standard deviation as 12.
- Click OK.
- Output using MINITAB software is given below:
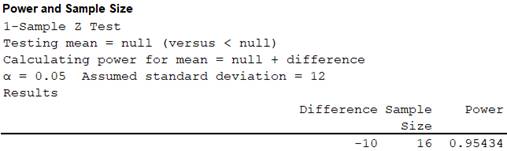
From the output, the power is 0.9543.
The value of
Thus, the value of
If the true mean is 485, the
Software procedure:
Step-by-step software procedure to obtain power using MINITAB is as follows:
- Select Stat > Power and sample size > 1 sample z.
- Enter Sample sizes as 16, Differences as –15, and Standard deviation as 12.
- Click OK.
- Output using MINITAB software is given below:
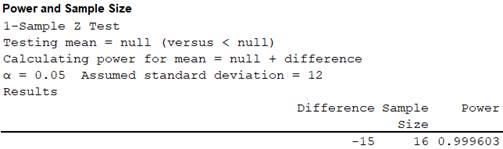
From the output, the power is 0.9996.
The value of
Thus, the value of
If the true mean is 480, the
Software procedure:
Step-by-step software procedure to obtain power using MINITAB is as follows:
- Select Stat > Power and sample size > 1 sample z.
- Enter Sample sizes as 16, Differences as –20, and Standard deviation as 12.
- Click OK.
- Output using MINITAB software is given below:
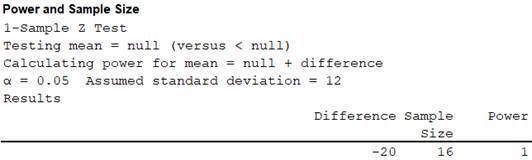
From the output, the power is 1.
The value of
Thus, the value of
Sketch the power curve.
Software procedure:
Step-by-step software procedure to construct the power curve using MINITAB is as follows:
- Choose Graph > Scatterplot.
- Choose With Connect Line, and then click OK.
- Under Y variables, enter Power.
- Under X variables, enter True mean.
- Click OK.
Want to see more full solutions like this?
Chapter 9 Solutions
Applied Statistics in Business and Economics


 MATLAB: An Introduction with ApplicationsStatisticsISBN:9781119256830Author:Amos GilatPublisher:John Wiley & Sons Inc
 Probability and Statistics for Engineering and th...StatisticsISBN:9781305251809Author:Jay L. DevorePublisher:Cengage Learning
 Statistics for The Behavioral Sciences (MindTap C...StatisticsISBN:9781305504912Author:Frederick J Gravetter, Larry B. WallnauPublisher:Cengage Learning
 Elementary Statistics: Picturing the World (7th E...StatisticsISBN:9780134683416Author:Ron Larson, Betsy FarberPublisher:PEARSON
 The Basic Practice of StatisticsStatisticsISBN:9781319042578Author:David S. Moore, William I. Notz, Michael A. FlignerPublisher:W. H. Freeman
 Introduction to the Practice of StatisticsStatisticsISBN:9781319013387Author:David S. Moore, George P. McCabe, Bruce A. CraigPublisher:W. H. Freeman