Videos
a.
Check whether the mean brightness exceeds the specification or not.
a.
Answer to Problem 109CE
There is evidence to infer that the mean brightness exceeds the specification.
Explanation of Solution
Calculation:
The given information is that, the data represents the sample of 24 test sheets from a day’s production run.
State the hypotheses:
Null hypothesis:
That is, the mean brightness is not greater than 106.
Alternative hypothesis:
That is, the mean brightness is greater than 106.
Critical value:
For right tailed test,
Degrees of freedom:
Software procedure:
Step-by-step software procedure to obtain critical value using EXCEL is as follows:
- Open an EXCEL file.
- In cell A1, enter the formula “=T.INV(0.995,23)”
- Output using Excel software is given below:
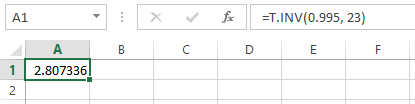
From the output, the critical value is 2.807.
Decision rule for right-tailed test at
If
- Sample mean and variance:
- The formula for mean is,
- The formula for standard deviation is,
- The value of
| Brightness | ||
| 106.98 | –0.01670 | 0.000279 |
| 107.02 | 0.02330 | 0.000543 |
| 106.99 | –0.00670 | 0.0000449 |
| 106.98 | –0.01670 | 0.000279 |
| 107.06 | 0.06330 | 0.004007 |
| 107.05 | 0.05330 | 0.002841 |
| 107.03 | 0.03330 | 0.001109 |
| 107.04 | 0.04330 | 0.001875 |
| 107.01 | 0.01330 | 0.000177 |
| 107.00 | 0.00330 | 0.0000109 |
| 107.02 | 0.02330 | 0.000543 |
| 107.04 | 0.04330 | 0.001875 |
| 107.00 | 0.00330 | 0.0000109 |
| 106.98 | –0.01670 | 0.000279 |
| 106.91 | –0.08670 | 0.007517 |
| 106.93 | –0.06670 | 0.004449 |
| 107.01 | 0.01330 | 0.000177 |
| 106.98 | –0.01670 | 0.000279 |
| 106.97 | –0.02670 | 0.000713 |
| 106.99 | –0.00670 | 0.0000449 |
| 106.94 | –0.05670 | 0.003215 |
| 106.98 | –0.01670 | 0.000279 |
| 107.03 | 0.03330 | 0.001109 |
| 106.98 | –0.01670 | 0.000279 |
- The standard deviation is,
- Thus, the standard deviation is 0.0373.
- Test statistic:
The formula for test statistic is,
Where
Substitute
Thus, the test statistic is 130.9.
Conclusion for critical value method:
Here, the test statistic is greater than the critical value.
That is,
Therefore, the null hypothesis is rejected.
Hence, there is evidence to infer that the mean brightness exceeds the specification.
b.
Check whether the sample shows that
b.
Answer to Problem 109CE
The sample does not show that
Explanation of Solution
Calculation:
Here, the hypotheses test is left-tailed test.
The test hypotheses are given below:
Null hypothesis:
That is, the true variance is greater than or equal to 0.0025.
Alternative hypothesis:
That is, the true variance is less than 0.0025.
Degrees of freedom:
Critical value:
From “Appendix E: CHI-SQAURE CRITICAL VALUES”,
- Locate the value 23 in the first column of the table.
- Locate the value 0.995 in the first row of the table.
- The intersecting value of row and column is 9.26.
Thus, the lower critical value is 9.26.
Decision rule for left-tailed test:
- If
- Otherwise, do not reject the null hypothesis
- Test statistic:
- Thus, the test statistic is 12.8.
Conclusion for critical value method:
Here, the test statistic is greater than critical value.
That is,
Therefore, the null hypothesis is not rejected.
Hence, the sample does not show that
Want to see more full solutions like this?
Chapter 9 Solutions
Applied Statistics in Business and Economics with Connect Access Card with LearnSmart


- The average expenditure per student (based on average daily attendance) for a certain school year was $10,337 with a population standard deviation of $1560. A survey for the next school year of 150 randomly selected students resulted in a sample mean of $10, 798. Find the P-value? Should the null hypothesis be rejected at alpha = .05 level of significance?arrow_forwardIn a random sample of 75 eighth grade students scores on a national mathematics assessment test has a mean score of 266. The test result prompts a state school administration to declare that the mean score for the stated eighth graders on this exam is more than 260. Assume the population standard deviation is 34. At a=0.09, is there enough evidence to support the administrations claim? Write the claim mathematically and identify Ho and Ha Find the standardized test statistic z, and its corresponding areaarrow_forwardSteel bars with a mean ultimate tensile strength of 400 Megapascal (MPa) with a variance of 81 MPa were delivered by the manufactured. The project engineer tested 50 steel bars and found out that the mean ultimate tensile strength is 390 MPa. The decision for the extension of the contract with the manufacturer depends on the engineer. Test the hypothesis whether there is no significant difference between the two means using a two-tailed with a=0.01arrow_forward
- A manufacturer of air conditioners seeks to ensure that their air conditioners are efficient enough that they will use no more than 2800 watt/hr under typical usage.The quality control department has tested a sample of 63 air conditioner units and found an average energy use of 7000 watts/hr. From previous tests, it can safely be assumed that the population standard deviation is 10000 watts/hr. Use the p-value approach and a 0.01 level of significance to test to see if the air conditioners are using too much energy. What is the P value?arrow_forwardIn a similar study using the same design (sample of n = 9 participants), the individuals who wore the shirt produced an average estimate of M = 6.4 with SS = 162. The average number who said they noticed was (population mean) 3.1. Calculate a One Sample t-test using a two-tailed test with alpha = .05. Please clearly label your critical values as well as your final t statistic score.arrow_forwardA quality control expert at a local dairy claims that its cartoons contain more than 64oz of milk a sample of 15 cartoons reveals a mean of 65 and 1.1 oxs respectively. At the 1% level, does the appropriate hypothesis support his claim? find and interpret the p valuearrow_forward
- A person read that the average number of hours and adult sleeps on Friday night to Saturday morning was 7.3 hours. The researcher feels that college students do not sleep 7.3 hours on average. The researcher randomly selected 17 students and found that on average they slept 8.5 hours. The standard deviation of the sample is 1.4 hours. At (alpha) = 0.01, is there enough evidence to say that college students do not sleep 7.3 hours on average? Assume that the population is approximately normally distributed. Use the critical value method and tables. A. State the hypotheses and identify the claim with the correct hypothesis. B. Find the critical value(s). C. Compute the test value. D. Make the decision. E. Summarize the results.arrow_forwardWhat is the critical value for a two sided t-test with an alpha = .02, and degrees of freedom = 29?arrow_forward
 MATLAB: An Introduction with ApplicationsStatisticsISBN:9781119256830Author:Amos GilatPublisher:John Wiley & Sons Inc
 Probability and Statistics for Engineering and th...StatisticsISBN:9781305251809Author:Jay L. DevorePublisher:Cengage Learning
 Statistics for The Behavioral Sciences (MindTap C...StatisticsISBN:9781305504912Author:Frederick J Gravetter, Larry B. WallnauPublisher:Cengage Learning
 Elementary Statistics: Picturing the World (7th E...StatisticsISBN:9780134683416Author:Ron Larson, Betsy FarberPublisher:PEARSON
 The Basic Practice of StatisticsStatisticsISBN:9781319042578Author:David S. Moore, William I. Notz, Michael A. FlignerPublisher:W. H. Freeman
 Introduction to the Practice of StatisticsStatisticsISBN:9781319013387Author:David S. Moore, George P. McCabe, Bruce A. CraigPublisher:W. H. Freeman