Understanding Basic Statistics
8th Edition
ISBN: 9781337558075
Author: Charles Henry Brase, Corrinne Pellillo Brase
Publisher: Cengage Learning
bartleby

Videos

Question
Book Icon
Chapter 9, Problem 10CRP

(a)

(i)

To determine

The level of significance, null and alternative hypothesis.

(a)

(i)

Expert Solution
Check Mark

Answer to Problem 10CRP

Solution:

The level of significance is α = 0.05. The null hypothesis is H0:μ=0.10 and alternative hypothesis H1:μ0.10.

Explanation of Solution

The level of significance is defined as the probability of rejecting the null hypothesis when it is true, it is denoted by α=0.05.

Null hypothesis H0:μ=0.10

Alternative hypothesis H1:μ0.10

(ii)

To determine

To find:

The sampling distribution that should be used and compute the value of the sample test statistic.

(ii)

Expert Solution
Check Mark

Answer to Problem 10CRP

Solution:

The normal distribution should be used. The sample test statisticis 1.29.

Explanation of Solution

Calculation:

We will use the normal distribution to binomial, if the condition np > 5 and nq > 5 are satisfied.

np=68*0.10=6.8nq=68*0.90=61.2

Both conditions are met, so we can use normal distribution.

Using r=10,n=68

p^=rn=1068=0.147

The sample test statistic z is

z=p^p0p0q0nz=0.1470.100.10*0.9068z=1.29

(iii)

To determine

To find:

The P-value of the test statistic and sketch the sampling distribution showing the area corresponding to the P-value.

(iii)

Expert Solution
Check Mark

Answer to Problem 10CRP

Solution:

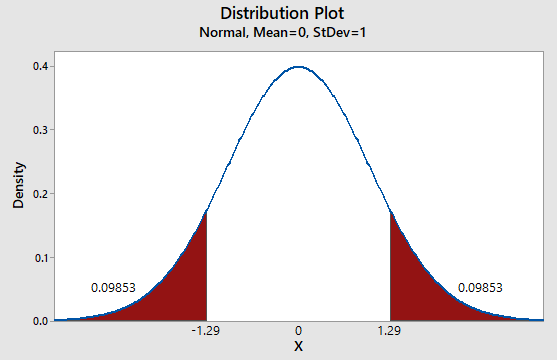
The P-value of the test statistic is 0.1970.

Explanation of Solution

Calculation:

We have z = 1.29

Pvalue=P(z>1.29)=1P(z1.29)Using Table 3 from the Appendix to find the specified area:=10.9015=0.0985

For a two tailed test, the P-value is 0.1970.

Graph:

To draw the required graphs using the Minitab, follow the below instructions:

Step 1: Go to the Minitab software.

Step 2: Go to Graph > Probability distribution plot > View probability.

Step 3: Select ‘Normal’ and Mean = 0, Standard deviation = 1.

Step 4: Click on the Shaded area > X value.

Step 5: Enter X-value as 1.29 and select ‘Both Tail’.

Step 6: Click on OK.

The obtained distribution graph is:

Understanding Basic Statistics, Chapter 9, Problem 10CRP

Pvalue=2(0.0985)Pvalue=0.1970

(iv)

To determine

Whether we reject or fail to reject the null hypothesisand whether the data is statistically significant for a level of significance of 0.05.

(iv)

Expert Solution
Check Mark

Answer to Problem 10CRP

Solution:

The P-value > α, hence we fail to reject the H0. The data is not statistically significant for a level of significance of 0.05.

Explanation of Solution

The P-value of 0.1970 is greater than the level of significance (α) of 0.05. Therefore we don't have enough evidence to reject the null hypothesis H0. Hence, the data is not statistically significant for a level of significance of 0.05.

(v)

To determine

The interpretation for the conclusion.

(v)

Expert Solution
Check Mark

Answer to Problem 10CRP

Solution:

There is not enough evidence to conclude that the students at this school are significantly different from the overall proportion of 16-19 year older who is victims of crime.

Explanation of Solution

The P-value of 0.1970 is greater than the level of significance (α) of 0.05. Therefore we don't have enough evidence to reject the null hypothesis H0. There is not enough evidence to conclude that the students at this school are significantly different from the overall proportion of 16-19 year older who is victims of crime.

(b)

To determine

To find:

The 90% confidence interval for the proportion of students in the school who have been victims of a crime.

(b)

Expert Solution
Check Mark

Answer to Problem 10CRP

Solution:

The 90% confidence interval for p is (0.079, 0.221).

Explanation of Solution

Calculation:

We have to find 90% confidence interval. Using,

p^=0.1470.15n=68UsingTable3ofAppendixzc=1.64

90% confidence interval is

p^zcp^(1p^)n<p<p^+zcp^(1p^)n0.151.6450.15*(10.15)68<p<0.15+1.6450.15*(10.15)680.079<μ<0.22

The 90% confidence interval for p is (0.079, 0.221).

(c)

To determine

To find: The minimum sample size so that the margin of error is not more than 0.05.

(c)

Expert Solution
Check Mark

Answer to Problem 10CRP

Solution:

The sample size is 193 so that the margin of error is not more than 0.05

Explanation of Solution

Calculation:

We have the sample size formula as follows

n=p^(1p^)(zcE)2p^=0.147E=0.05UsingTable3ofAppendixzc=1.96

n=p^(1p^)(zcE)2n=(0.147)(0.853)[1.960.05]2n=192.68n193

Therefore n = 193 is the minimum sample size to ensure that the margin of error E is not more than 0.05.

Want to see more full solutions like this?

Subscribe now to access step-by-step solutions to millions of textbook problems written by subject matter experts!

Chapter 9 Solutions

Understanding Basic Statistics

Ch. 9.1 - Basic Computation: Setting Hypotheses Suppose you...Ch. 9.1 - Basic Computation: Setting Hypotheses Suppose you...Ch. 9.1 - Prob. 13PCh. 9.1 - Basic Computation: Find the Test Statistic....Ch. 9.1 - Veterinary Science: Colts The body weight of a...Ch. 9.1 - Marketing: Shopping Time How much customers buy is...Ch. 9.1 - Meteorology: StormsWeatherwise magazine is...Ch. 9.1 - Ford Mustang: Acceleration Motor Trend stated that...Ch. 9.1 - For Problems 19-24, please provide the following...Ch. 9.1 - For Problems 19-24, please provide the following...Ch. 9.1 - For Problems 19-24, please provide the following...Ch. 9.1 - For Problems 19-24, please provide the following...Ch. 9.1 - For Problems 19-24, please provide the following...Ch. 9.1 - For Problems 19-24, please provide the following...Ch. 9.2 - Statistical Literacy For the same sample data and...Ch. 9.2 - Statistical Literacy To test for an x...Ch. 9.2 - Statistical Literacy When using the Students t...Ch. 9.2 - Critical Thinking Consider a test for . If the...Ch. 9.2 - Critical Thinking Consider a test for .If the...Ch. 9.2 - Critical Thinking If sample data is such that for...Ch. 9.2 - Basic Computation: P-value Corresponding to t...Ch. 9.2 - Basic Computation: P-value Corresponding to t...Ch. 9.2 - Basic Computation: Testing , Unknown A random...Ch. 9.2 - Basic Computation: Testing , Unknown A random...Ch. 9.2 - (c) Find (or estimate) the P-value. Sketch the...Ch. 9.2 - Please provide the following information for...Ch. 9.2 - Please provide the following information for...Ch. 9.2 - Please provide the following information for...Ch. 9.2 - Please provide the following information for...Ch. 9.2 - Please provide the following information for...Ch. 9.2 - Please provide the following information for...Ch. 9.2 - Please provide the following information for...Ch. 9.2 - Please provide the following information for...Ch. 9.2 - Please provide the following information for...Ch. 9.2 - Please provide the following information for...Ch. 9.2 - Please provide the following information for...Ch. 9.2 - Critical Thinking: One-Tailed versus Two-Tailed...Ch. 9.2 - Expand Your Knowledge: Two Confidence Intervals...Ch. 9.2 - Prob. 25PCh. 9.2 - Prob. 26PCh. 9.2 - Prob. 27PCh. 9.2 - Prob. 28PCh. 9.2 - Critical Region Method: Student'st Solve Problem...Ch. 9.2 - Critical Region Method: Student'st Solve Problem...Ch. 9.3 - Terminology Answer true or false. The margin of...Ch. 9.3 - Prob. 2PCh. 9.3 - Prob. 3PCh. 9.3 - Terminology Answer true or false. The margin of...Ch. 9.3 - Basic Computation: Testingp A random sample of 30...Ch. 9.3 - Basic Computation: Testingp A random sample of 60...Ch. 9.3 - For Problems 7-21, please provide the following...Ch. 9.3 - For Problems 7-21, please provide the following...Ch. 9.3 - For Problems 7-21. please provide the following...Ch. 9.3 - For Problems 7-21. please provide the following...Ch. 9.3 - For Problems 7-21, please provide the following...Ch. 9.3 - For Problems 7-21. please provide the following...Ch. 9.3 - For Problems 7-21, please provide the following...Ch. 9.3 - For Problems 7-21, please provide the following...Ch. 9.3 - For Problems 7-21. please provide the following...Ch. 9.3 - For Problems 7-21, please provide the following...Ch. 9.3 - For Problems 7-21. please provide the following...Ch. 9.3 - For Problems 7-21, please provide the following...Ch. 9.3 - For Problems 721, please provide the following...Ch. 9.3 - For Problems 721, please provide the following...Ch. 9.3 - For Problems 721, please provide the following...Ch. 9.3 - Critical Region Method: Testing Proportions Solve...Ch. 9.3 - Prob. 23PCh. 9.3 - Prob. 24PCh. 9 - Terminology Answer each of the following...Ch. 9 - Terminology Answer each of the following...Ch. 9 - Statistical Literacy When testing how do we...Ch. 9 - Statistical Literacy What do we mean when we say a...Ch. 9 - Critical Thinking All other conditions being...Ch. 9 - Critical Thinking All other conditions being...Ch. 9 - Before you solve each problem below, first...Ch. 9 - Before you solve each problem below, first...Ch. 9 - Before you solve each problem below, first...Ch. 9 - Before you solve each problem below, first...Ch. 9 - Before you solve each problem below, first...Ch. 9 - Before you solve each problem below, first...Ch. 9 - Before you solve each problem below, first...Ch. 9 - Before you solve each problem below, first...Ch. 9 - Prob. 1DHGPCh. 9 - Prob. 1LCWPCh. 9 - Prob. 2LCWPCh. 9 - The following statements are very important. Give...Ch. 9 - Prob. 4LCWPCh. 9 - As access to computers becomes more and more...Ch. 9 - Prob. 1CRPCh. 9 - Prob. 2CRPCh. 9 - Statistical Literacy Please give a careful but...Ch. 9 - Prob. 4CRPCh. 9 - Normal Approximation to the Binomial the majority...Ch. 9 - Prob. 6CRPCh. 9 - Sampling Distribution p Do you have a great deal...Ch. 9 - In Problems 8-12, please use the following steps...Ch. 9 - In Problems 8-12, please use the following steps...Ch. 9 - Prob. 10CRPCh. 9 - In Problems 8-12, please use the following steps...Ch. 9 - In Problems 8-12, please use the following steps...
Knowledge Booster
Background pattern image
Statistics
Learn more about
Need a deep-dive on the concept behind this application? Look no further. Learn more about this topic, statistics and related others by exploring similar questions and additional content below.
Recommended textbooks for you
Text book image
MATLAB: An Introduction with Applications
Statistics
ISBN:9781119256830
Author:Amos Gilat
Publisher:John Wiley & Sons Inc
Text book image
Probability and Statistics for Engineering and th...
Statistics
ISBN:9781305251809
Author:Jay L. Devore
Publisher:Cengage Learning
Text book image
Statistics for The Behavioral Sciences (MindTap C...
Statistics
ISBN:9781305504912
Author:Frederick J Gravetter, Larry B. Wallnau
Publisher:Cengage Learning
Text book image
Elementary Statistics: Picturing the World (7th E...
Statistics
ISBN:9780134683416
Author:Ron Larson, Betsy Farber
Publisher:PEARSON
Text book image
The Basic Practice of Statistics
Statistics
ISBN:9781319042578
Author:David S. Moore, William I. Notz, Michael A. Fligner
Publisher:W. H. Freeman
Text book image
Introduction to the Practice of Statistics
Statistics
ISBN:9781319013387
Author:David S. Moore, George P. McCabe, Bruce A. Craig
Publisher:W. H. Freeman
What Are Research Ethics?; Author: HighSchoolScience101;https://www.youtube.com/watch?v=nX4c3V23DZI;License: Standard YouTube License, CC-BY
What is Ethics in Research - ethics in research (research ethics); Author: Chee-Onn Leong;https://www.youtube.com/watch?v=W8Vk0sXtMGU;License: Standard YouTube License, CC-BY