
Intro Stats + New Mylab Statistics With Pearson Etext:
5th Edition
ISBN: 9780134210230
Author: De Veaux, Richard D.
Publisher: Pearson College Div
expand_more
expand_more
format_list_bulleted
Concept explainers
Videos
Textbook Question
Chapter 9, Problem 18E
More hill races Here is the regression for the women’s records for the same Scottish hill races we considered in Exercise 14:
Dependent variable is: Women’s Time (mins)
R-squared = 96.7% s = 10.06
| Variable | Coefficient |
| Intercept | –11.6545 |
| Climb (m) | 0.045195 |
| Distance | 4.43427 |
- a) Compare the regression model for the women’s records with that found for the men’s records in Exercise 14.
Here’s a
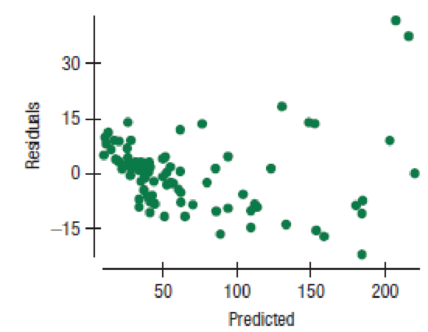
- b) Discuss the residuals and what they say about the assumptions and conditions for this regression.
Expert Solution & Answer
Want to see the full answer?
Check out a sample textbook solution
Chapter 9 Solutions
Intro Stats + New Mylab Statistics With Pearson Etext:
Ch. 9.4 - Recall the regression example in Chapter 7 to...Ch. 9.4 - Prob. 2JCCh. 9.4 - Prob. 3JCCh. 9 - Housing prices The following regression model was...Ch. 9 - Candy sales A candy maker surveyed chocolate bars...Ch. 9 - Prob. 3ECh. 9 - Prob. 4ECh. 9 - Prob. 5ECh. 9 - Prob. 6ECh. 9 - Movie profits once more Look back at the...
Ch. 9 - Prob. 8ECh. 9 - Prob. 9ECh. 9 - More indicators For each of these potential...Ch. 9 - Interpretations A regression performed to predict...Ch. 9 - Prob. 12ECh. 9 - Prob. 13ECh. 9 - Scottish hill races Hill runningraces up and down...Ch. 9 - Prob. 15ECh. 9 - Candy bars per serving: calories A student...Ch. 9 - Prob. 17ECh. 9 - More hill races Here is the regression for the...Ch. 9 - Prob. 19ECh. 9 - Home prices II Here are some diagnostic plots for...Ch. 9 - Admin performance The AFL-CIO has undertaken a...Ch. 9 - GPA and SATs A large section of Stat 101 was asked...Ch. 9 - Prob. 23ECh. 9 - Breakfast cereals We saw in Chapter 7 that the...Ch. 9 - Breakfast cereals again We saw a model in Exercise...Ch. 9 - Prob. 26ECh. 9 - Hand dexterity Researchers studied the dexterity...Ch. 9 - Candy bars with nuts The data on candy bars per...Ch. 9 - Scottish hill races, men and women The Scottish...Ch. 9 - Scottish hill races, men and women climbing The...
Knowledge Booster


Learn more about
Need a deep-dive on the concept behind this application? Look no further. Learn more about this topic, statistics and related others by exploring similar questions and additional content below.Similar questions
- XYZ Corporation Stock Prices The following table shows the average stock price, in dollars, of XYZ Corporation in the given month. Month Stock price January 2011 43.71 February 2011 44.22 March 2011 44.44 April 2011 45.17 May 2011 45.97 a. Find the equation of the regression line. Round the regression coefficients to three decimal places. b. Plot the data points and the regression line. c. Explain in practical terms the meaning of the slope of the regression line. d. Based on the trend of the regression line, what do you predict the stock price to be in January 2012? January 2013?arrow_forwardZipfs Law The following table shows U.S cities by rank in terms of population and population in thousands. City Rank r Population N New York 1 8491 Chicago 3 2722 Philadelphia 5 1560 Dallas 9 1280 Austin 11 913 San Francisco 13 852 Columbus 15 836 A rule known as Zipfs law tells us that it is reasonable to approximate these data with a power function. a Use power regression to express the population as a function of the rank. b Plot the data along with the power function from part a. c Phoenix is the sixth largest city in the United States. Use your answer from part a to estimate population of Phoenix. Round your answer in thousands to the nearest whole number. Note: The actual population is 1537 thousand.arrow_forwardRemainder Round all answers to two decimal places unless otherwise indicated. Cell Phones The following table gives the amount spent on cellular service worldwide, in trillions of U.S. dollars. Round the regression parameters to three decimal places. Date Cellular service revenue 2011 1.01 2012 1.05 2013 1.09 2014 1.11 a.Plot the data points. b.Find the equation of the regression line and add its graph to the plotted data. c.In 2015, 1.14 trillion was spent on cellular service. If you had been a financial strategist in 2014 with only the data in the table above available, what would been your prediction for the amount spent on cellular service in 2015?arrow_forward
- Remainder Round all answers to two decimal places unless otherwise indicated. Gross Domestic Product U.S. gross domestic product, in trillions of dollars, is given in the table below. Date Gross domestic product 2010 15.0 2011 15.5 2012 16.2 2013 16.7 a.Find the equation of the regression line, and explain the meaning of its slope. Round regression line parameters to two decimal places. b.Plot the data points and the regression line. c.When would you predict that a gross domestic product of 17.3 trillion dollars would be reached? The actual gross domestic product in 2014 was 17.3 trillion dollars. What does that say about your prediction?arrow_forwardNoise and Intelligibility Audiologists study the intelligibility of spoken sentences under different noise levels. Intelligibility, the MRT score, is measured as the percent of a spoken sentence that the listener can decipher at a cesl4ain noise level in decibels (dB). The table shows the results of one such test. (a) Make a scatter plot of the data. (b) Find and graph the regression line. (c) Find the correlation coefficient. Is a linear model appropriate? (d) Use the linear model in put (b) to estimate the intelligibility of a sentence at a 94-dB noise level.arrow_forwardRemainder Round all answers to two decimal places unless otherwise indicated. Domestic Auto Sales in the United States For 2005 through 2008, the following table shows the total U.S. sales, in millions, of domestic automobiles excluding light trucks. Date Domestic cars sold 2005 5.53 2006 5.48 2007 5.25 2008 4.54 a.Get the equation of the regression line rounding parameters to two decimal places, and explain in practical terms the meaning of the slope. In particular, comment on the meaning of the sign of the slope. b.Plot the data points and the regression line. c.In 2009, 3.62 million domestic cars were sold in the United States. How does the forecast obtained from the regression line compare with this figure?arrow_forward
- Demand for Candy Bars In this problem you will determine a linear demand equation that describes the demand for candy bars in your class. Survey your classmates to determine what price they would be willing to pay for a candy bar. Your survey form might look like the sample to the left. a Make a table of the number of respondents who answered yes at each price level. b Make a scatter plot of your data. c Find and graph the regression line y=mp+b, which gives the number of respondents y who would buy a candy bar if the price were p cents. This is the demand equation. Why is the slope m negative? d What is the p-intercept of the demand equation? What does this intercept tell you about pricing candy bars? Would you buy a candy bar from the vending machine in the hallway if the price is as indicated. Price Yes or No 50 75 1.00 1.25 1.50 1.75 2.00arrow_forwardA regression was run to determine whether there is arelationship between the diameter of a tree (x, in inches) and the tree’s age (y, in years). Theresults of the regression are given below. Use this topredict the age of a tree with diameter 10 inches. y=ax+ba=6.301b=1.044r=0.970arrow_forwardSpecial Rounding Instructions For this exercise set, round all regression parameters to three decimal places, but round all other answers to two decimal places unless otherwise indicated. Atmospheric Pressure The table below gives a measurement of atmospheric pressure, in grams per square centimeter, at the given altitude, in kilometers. Altitude Atmospheric Pressure 5 569 10 313 15 172 20 95 25 52 For comparison, 1 kilometer is about 0.6 mile, and 1 gram per square centimeter is about 2 pounds per square foot. a.Plot the data on atmospheric pressure. b.Make an exponential model for the data on atmospheric pressure. c.What is the atmospheric pressure at an altitude of 30 kilometers? d.Find the atmospheric pressure on Earths surface. This is termed standard atmospheric pressure. e.At what altitude is the atmospheric pressure equal to 25 of standard atmospheric pressure?arrow_forward
- Special Rounding Instructions For this exercise set, round all regression parameters to three decimal places, but round all other answers to two decimal places unless otherwise indicated. Postal RatesThe table below shows the cost s, in cents, of a domestic first-class postage stamp in the United States tyears after 1900. t=time,inyearssince1900 s=costofstamp 19 2 32 3 58 4 71 8 78 15 85 22 95 32 102 37 109 44 116 47 a.Use exponential regression to model s as an exponential function of t. b.What cost does your model give for a 1988 stamp? Report your answer to the nearest cent. The actual cost was 25cents. c.Plot the data and the exponential model.arrow_forwardSpecial Rounding Instructions For this exercise set, round all regression parameters to three decimal places, but round all other answers to two decimal places unless otherwise indicated. Gray Wolves in WisconsinGray wolves were among the first mammals protected under the Endangered Species Act in the 1970s. Wolves recolonized in Wisconsin beginning in 1980.Their population grew reliably after 1985 as follows: Year Wolves Year Wolves 1985 15 1993 40 1986 16 1994 57 1987 18 1995 83 1988 28 1996 99 1989 31 1997 145 1990 34 1998 178 1991 40 1999 197 1992 45 2000 266 a. Explain why an exponential model may be appropriate. b. Are these data exactly exponential? Explain. c. Find an exponential model for these data. d. Plot the data and the exponential model. e. Comment on your graph in part d. Which data points are below or above the number predicted by the exponential model?arrow_forwardSpecial Rounding Instructions. For this exercise set, round all regression parameters to three decimal places, but round all other answers to two decimal places unless otherwise indicated. Growth in Length of HaddockA study by Raitt showed that the maximum length that a haddock could be expected to grow is about 53centimeters.Let D=D(t) denote the difference between 53centimeters and the length at age t years. The table below gives experimentally collected values for D. Age t Difference D 2 28.2 5 16.1 7 9.5 13 3.3 19 1.0 a.Find an exponential model of D as a function of t. b.Let L=L(t) denote the length in centimeters of a haddock at age t years. Find the model for L as a function of t. c.Plot the graph of the experimentally gathered data for the length L at ages 2,5,7,13, and 19years along with the graph of the model you made for L. Does this graph show that the 5year old haddock is a bit shorter or a bit longer than would be expected? d.A fisherman has caught a haddock that measures 41centimeters. What is the approximate age of the haddock?arrow_forward
arrow_back_ios
SEE MORE QUESTIONS
arrow_forward_ios
Recommended textbooks for you
 Glencoe Algebra 1, Student Edition, 9780079039897...AlgebraISBN:9780079039897Author:CarterPublisher:McGraw Hill
 College AlgebraAlgebraISBN:9781305115545Author:James Stewart, Lothar Redlin, Saleem WatsonPublisher:Cengage Learning
 Functions and Change: A Modeling Approach to Coll...AlgebraISBN:9781337111348Author:Bruce Crauder, Benny Evans, Alan NoellPublisher:Cengage Learning
 Algebra and Trigonometry (MindTap Course List)AlgebraISBN:9781305071742Author:James Stewart, Lothar Redlin, Saleem WatsonPublisher:Cengage Learning
Glencoe Algebra 1, Student Edition, 9780079039897...
Algebra
ISBN:9780079039897
Author:Carter
Publisher:McGraw Hill
College Algebra
Algebra
ISBN:9781305115545
Author:James Stewart, Lothar Redlin, Saleem Watson
Publisher:Cengage Learning
Functions and Change: A Modeling Approach to Coll...
Algebra
ISBN:9781337111348
Author:Bruce Crauder, Benny Evans, Alan Noell
Publisher:Cengage Learning
Algebra and Trigonometry (MindTap Course List)
Algebra
ISBN:9781305071742
Author:James Stewart, Lothar Redlin, Saleem Watson
Publisher:Cengage Learning
Correlation Vs Regression: Difference Between them with definition & Comparison Chart; Author: Key Differences;https://www.youtube.com/watch?v=Ou2QGSJVd0U;License: Standard YouTube License, CC-BY
Correlation and Regression: Concepts with Illustrative examples; Author: LEARN & APPLY : Lean and Six Sigma;https://www.youtube.com/watch?v=xTpHD5WLuoA;License: Standard YouTube License, CC-BY