Statistics for the Behavioral Sciences
2nd Edition
ISBN: 9781452286907
Author: Gregory J. Privitera
Publisher: SAGE Publications, Inc
bartleby

Videos

Question
Book Icon
Chapter 9, Problem 21CAP

(a)

To determine

Check whether the consumption of saccharin-flavored water differ in groups or not.

Find the test statistic value and make a decision to retain or reject the null hypothesis

(a)

Expert Solution
Check Mark

Answer to Problem 21CAP

The test statistic value is 4.27.

The decision is to reject the null hypothesis.

There is significant difference between the consumption of saccharin-flavoured water of two groups.

Explanation of Solution

Calculation:

A sample of 8 rats is considered and they are rats feel sick and control group rats. The claim is the there is difference between the consumption of saccharin-flavoured water of two groups. This represents the alternative hypothesis. The level of significance is 0.05.

Let μ1 is average amount consumed by rats were made sick, and μ2 is average amount consumed by control rats.

Null hypothesis:

H0:μ1=μ2

That is, there is no difference between the consumption of saccharin-flavoured water of two groups.

Alternative hypothesis:

H1:μ1μ2

That is, there is difference between the consumption of saccharin-flavoured water of two groups.

The degrees of freedom for t distribution is,

df=(n11)+(n21)=(41)+(41)=3+3=6

The test is two tailed, the degrees of freedom are 6, the level of significance is 0.05.

From the Appendix B: Table B.2 The t Distribution:

  • Locate the value 6 in the degrees of freedom (df) column.
  • Locate the 0.05 in the proportion in Two tails combined row.
  • The intersecting value that corresponds to the 6 with level of significance 0.05 is 2.447.

The critical value for a two-tailed test with α=0.05 is ±2.447.

Decision rules:

  • If the positive test statistic value is greater than the positive critical value, then reject the null hypothesis or else retain the null hypothesis.
  • If the negative test statistic value is less than negative critical value, then reject the null hypothesis or else retain the null hypothesis.

The formula of test statistic for one-sample t test is,

tobt=(M1M2)(μ1μ2)sM1M2

In the formula, M1 is first sample mean, M2 is second sample mean, μ1 is first population mean, μ2 is second population mean, sM2M2 is estimated standard error of difference given as,

sM2M2=sp2n1+sp2n2 and sp2=s12(df1)+s22(df2)df1+df2.

In the formula, s12 is the sample variance of the first sample, s22 is the sample variance of the second sample, df1 are the degrees of freedom for first sample and df2 are the degrees of freedom for second sample.

Software procedure:

Step by step procedure to obtain test statistic value using SPSS software is given as,

  • Choose Variable view.
  • Under the name, enter the names as Amounts, and Types of Rats.
  • Choose Data view, enter the data.
  • Choose Analyze>Compare means>Independent Samples T Test.
  • In Test variables, enter the column as Amounts.
  • In Grouping variables, enter thecolumn asTypes of Rats.
  • Select Define Groups; enter Group 1 as 1 and Group 2 as 2.
  • Click OK.

Output using SPSS software is given below:

Statistics for the Behavioral Sciences, Chapter 9, Problem 21CAP , additional homework tip  1

Statistics for the Behavioral Sciences, Chapter 9, Problem 21CAP , additional homework tip  2

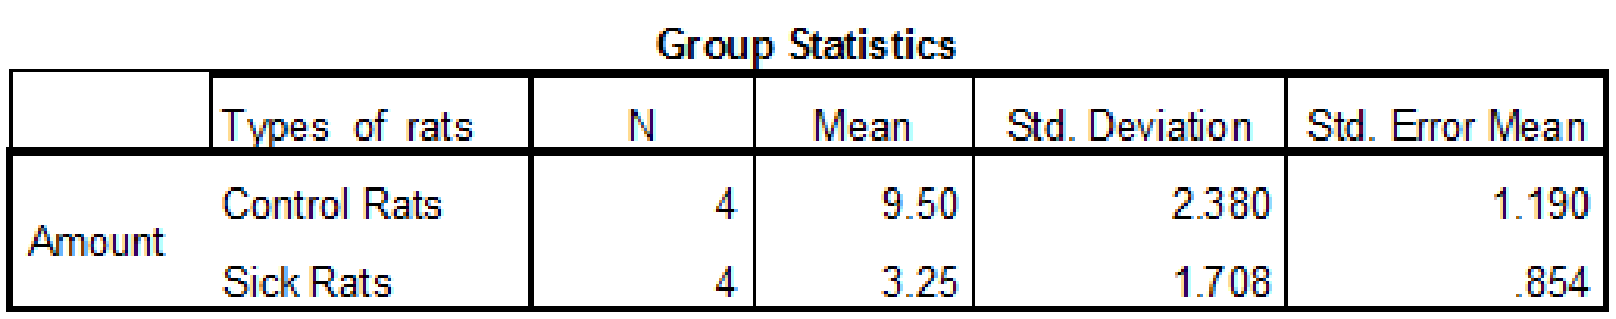
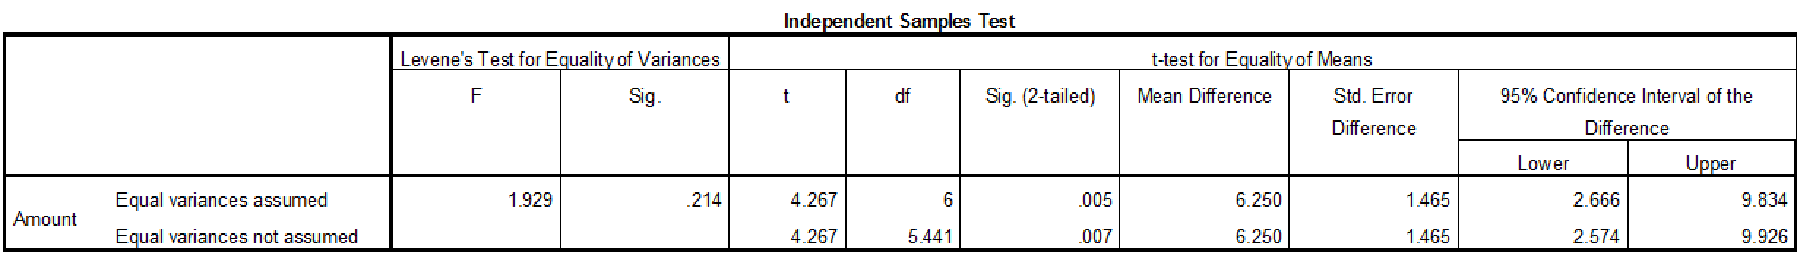
Thus, the test statistic value is 4.27.

Justification: The value of test statistic is 4.27 and critical value is 2.447. The test statistic value is greater than the critical value. The test statistic value fall under critical region and hence the null hypothesis is rejected.

Thus, there is significant difference between the consumption of saccharin-flavoured water of two groups.

(b)

To determine

Find the effect size by using eta-squared.

(b)

Expert Solution
Check Mark

Answer to Problem 21CAP

The value of eta-squared is 0.75.

The effect size is large.

Explanation of Solution

Eta-square:

The proportion of variance is measured using eta-square. But eta-square is biased because it over estimates the proportion of variance that is explained by treatment. It is denoted by (η2).

η2=t2t2+df

In the formula, t is the value of test statistic and df is the corresponding degrees of freedom.

The description of effect size using eta-square:

  • If value of eta-square is less than 0.01, then effect size is trivial.
  • If value of eta-square is in between 0.01 and 0.09, then effect size is small.
  • If value of eta-square is in between 0.10 and 0.25, then effect size is medium.
  • If value of eta-square is greater than 0.25, then effect size is large.

Calculation:

From the SPSS output, the test statistic value is 4.27 and df is 6. The value of Cohen’s d is,

η2=(4.27)2(4.27)2+6=18.232918.2329+6=18.232924.2329=0.75

The value of estimated eta-square is 0.75. This value is greater than 0.25. Hence the eta-square has a large effect size.

Want to see more full solutions like this?

Subscribe now to access step-by-step solutions to millions of textbook problems written by subject matter experts!
Students have asked these similar questions
In a study attempting to replicate findings by Stephens, Atkins, & Kingston (2009), each participant was asked to plunge a hand into the icy water and keep it there as long as the pain would allow. In one condition, the participants repeated their favorite curse words while their hands were in the water. In the other condition, they repeated neutral words. The original research showed that, in addition to lowering the participants’ perception of pain, swearing also increased the amount of time they were able to tolerate the pain. Data similar to the results obtained in the study are shown in the following table: _____________Amount of Time (in Seconds)_                Participant            Swear Words     Neutral Words                1                                              94                           59 2                                              70                           61 3                                              52                           47 4…
Researchers interested in lead exposure due to car exhaust sampled the blood of 52 police officers subjected to constant inhalation of automobile exhaust fumes while working traffic enforcement in a primarily urban environment. The blood samples of these officers had an average lead concentration of 124.32 µg/l and a SD of 37.74 µg/l; a previous study of individuals from a nearby suburb, with no history of exposure, found an average blood level concentration of 35 µg/l. Test the hypothesis that the downtown police officers have a higher lead exposure than the group in the previous study. Interpret your results in context. Based on your preceding result, without performing a calculation, would a 99% confidence interval for the average blood concentration level of police officers contain 35 µg/l? Based on your preceding result, without performing a calculation, would a 99% confidence interval for this difference contain 0? Explain why or why not.
Knowledge Booster
Background pattern image
Statistics
Learn more about
Need a deep-dive on the concept behind this application? Look no further. Learn more about this topic, statistics and related others by exploring similar questions and additional content below.
Recommended textbooks for you
Text book image
Holt Mcdougal Larson Pre-algebra: Student Edition...
Algebra
ISBN:9780547587776
Author:HOLT MCDOUGAL
Publisher:HOLT MCDOUGAL
Text book image
Glencoe Algebra 1, Student Edition, 9780079039897...
Algebra
ISBN:9780079039897
Author:Carter
Publisher:McGraw Hill
Text book image
Trigonometry (MindTap Course List)
Trigonometry
ISBN:9781337278461
Author:Ron Larson
Publisher:Cengage Learning
what is Research Design, Research Design Types, and Research Design Methods; Author: Educational Hub;https://www.youtube.com/watch?v=LpmGSioXxdo;License: Standard YouTube License, CC-BY