Videos
Problem 9-23 Ratio analysis
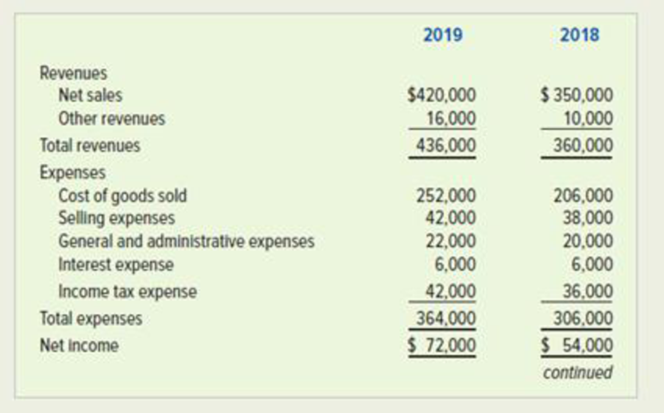
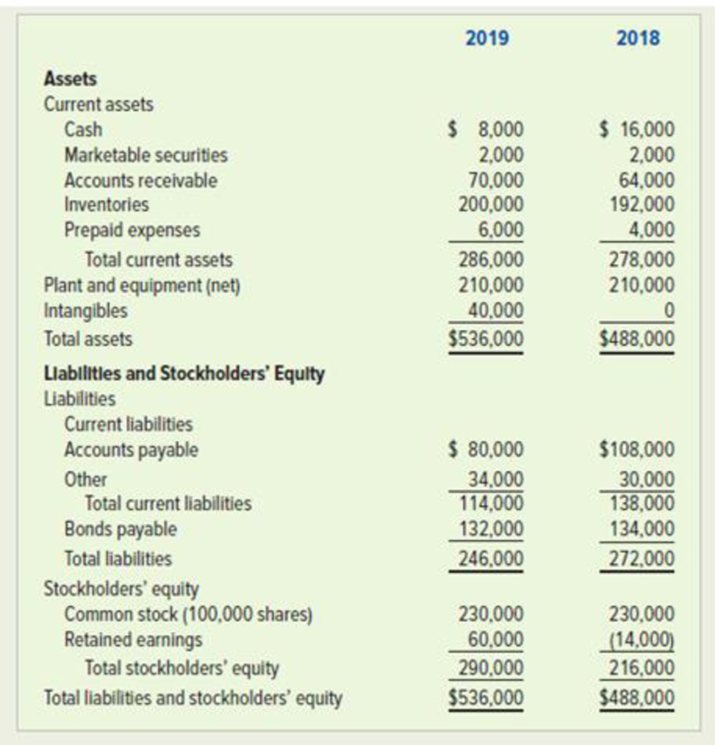
The following financial statements apply to Karl Company:
Required
Calculate the following ratios for 2018 and 2019. When data limitations prohibit computing averages, use year-end balances in your calculations. Round computations to two decimal points.
- a. Net margin.
- b. Return on investment.
- c. Return on equity.
- d. Earnings per share.
- e. Price-earnings ratio (market prices at the end of 2018 and 2019 were $11.88 and $9.54, respectively).
- f. Book value per share of common stock.
- g. Times interest earned.
- h.
Working capital . - i.
Current ratio . - j. Quick (acid-test) ratio.
- k.
Accounts receivable turnover. - l. Inventory turnover.
- m. Debt to equity ratio.
- n. Debt to assets ratio.
a.
Compute net margin of Company K for 2019 and 2018.
Explanation of Solution
Net margin: It is one of the profitability ratios. Profit margin ratio is used to measure the percentage of net income that is being generated per dollar of revenue or sales.
Compute net margin of Company K for 2019 and 2018:
| Ratios and Formula | 2019 | 2018 |
|
Net margin: |
Table (1)
Thus, the net margin of Company K for 2019 and 2018 are 17.14% and 15.42% respectively.
b.
Compute return on investment of Company K for 2019 and 2018.
Explanation of Solution
Return on investments (assets): Return on investments (assets) is the financial ratio which determines the amount of net income earned by the business with the use of total assets owned by it. It indicates the magnitude of the company’s earnings with relative to its total assets. Return on investment is calculated as follows:
Compute return on investment of Company K for 2019 and 2018:
| Ratios and Formula | 2019 | 2018 |
|
Return on investment: |
Table (2)
Note: Since, the beginning total assets for 2018 are not given. So, the total amount of total assets for 2018 is assumed as average total assets.
Working note:
(1) Determine the amount of average total assets for 2019.
Thus, the return on investment of Company K for 2019 and 2018 are 14.06% and 11.07% respectively.
c.
Compute return on equity of Company K for 2019 and 2018.
Explanation of Solution
Return on equity: It is a profitability ratio that measures the profit generating ability of the company from the invested money of the shareholders. The formula to calculate the return on equity is as follows:
Compute return on equity of Company K for 2019 and 2018:
| Ratios and Formula | 2019 | 2018 |
|
Return on equity: |
Table (3)
Note: Since, the beginning stockholders’ equity for 2018 is not given. So, the total amount of stockholders’ equity for 2018 is assumed as average total stockholders’ equity.
Working Note:
(2) Determine the amount of average total stockholders’ equity for 2019.
Thus, the return on equity of Company K for 2019 and 2018 are 28.46% and 25% respectively.
d.
Compute earnings per share of Company K for 2019 and 2018.
Explanation of Solution
Earnings per Share: Earnings per share help to measure the profitability of a company. Earnings per share are the amount of profit that is allocated to each share of outstanding stock.
Compute earnings per share of Company K for 2019 and 2018:
| Ratios and Formula | 2019 | 2018 |
|
Earnings per share: |
Table (4)
Thus, the earnings per share of Company K for 2019 and 2018 are $0.72 per share and $0.54 per share respectively.
e.
Compute price-earnings ratio of Company K for 2019 and 2018.
Explanation of Solution
Price/Earnings Ratio: The price/earnings ratio shows the market value of the amount invested to earn $1 by a company. It is major tool used by investors for making decisions related to the investment in a company.
Compute price-earnings ratio of Company K for 2019 and 2018:
| Ratios and Formula | 2019 | 2018 |
|
Price-earnings ratio: |
Table (5)
Note: The earnings per share for both years are computed in requirement d.
Thus, the price-earnings ratio of Company K for 2019 and 2018 are 13.25 times and 22 times respectively.
f.
Compute book value per share of common stock of Company K for 2019 and 2018.
Explanation of Solution
Book value per share of common stock: This ratio is a measure of a share of common stock that is used to determine the value of per share based on the equity available to the common stockholders. This ratio is calculated by using the formula:
Compute book value per share of common stock of Company K for 2019 and 2018:
| Ratios and Formula | 2019 | 2018 |
|
Book value per share of common stock: |
Table (6)
Thus, the book value per share of common stock of Company K for 2019 and 2018 are $2.90 per share and $2.16 per share respectively.
g.
Compute times interest earned of Company K for 2019 and 2018.
Explanation of Solution
Time’s interest earned: Number of times interest is earned quantifies the number of times the earnings before interest and taxes can pay the interest expense. First, determine the sum of income before income tax and interest expense. Then, divide the sum by interest expense.
Compute times interest earned of Company K for 2019 and 2018:
| Ratios and Formula | 2019 | 2018 |
|
Times interest earned: |
Table (7)
Working Note:
(3) Determine the amount of earnings before interest and expenses for 2019.
(4) Determine the amount of earnings before interest and expenses for 2018.
Thus, the times interest earned ratio of Company K for 2019 and 2018 is 20.00 times and 16.00 times respectively.
h.
Compute working capital of Company K for 2019 and 2018.
Explanation of Solution
Working capital: Working capital refers to the excess amount of current assets over its current liabilities of a business. It measures the excess funds that are required for the companies to carry out their day to day operations, excluding any new funds that have been invested during the year. Working capital is calculated by using the formula:
Compute working capital of Company K for 2019 and 2018:
| Ratios and Formula | 2019 | 2018 |
|
Working Capital: |
Table (8)
Thus, the working capital of Company K for 2019 and 2018 is $172,000 and $140,000 respectively.
i.
Compute current ratio of Company K for 2019 and 2018.
Explanation of Solution
Current ratio: Current ratio is one of the liquidity ratios, which measures the capacity of the company to meet its short-term obligations using its current assets. Current ratio is calculated by using the formula:
Compute current ratio of Company K for 2019 and 2018:
| Ratios and Formula | 2019 | 2018 |
|
Current ratio: |
Table (9)
Thus, the current ratio of Company K for 2019 and 2018 is 2.50:1 and 2.01:1 respectively.
j.
Compute quick ratio of Company K for 2019 and 2018.
Explanation of Solution
Quick ratio: It is a ratio used to determine a company’s ability to pay back its current liabilities by liquid assets that are current assets except inventory and prepaid expenses.
Compute quick ratio of Company K for 2019 and 2018:
| Ratios and Formula | 2019 | 2018 |
|
Quick ratio: |
Table (10)
Note: Quick assets include cash, marketable securities and accounts receivable.
Thus, the quick ratio of Company K for 2019 and 2018 is 0.70:1 and 0.59:1 respectively.
k.
Compute receivables turnover of Company K for 2019 and 2018.
Explanation of Solution
Account Receivables turnover ratio: Account Receivables turnover ratio is mainly used to evaluate the collection process efficiency. It helps the company to know the number of times the accounts receivable is collected in a particular time period. This ratio is determined by dividing credit sales and average account receivables.
Compute receivables turnover of Company K for 2019 and 2018:
| Ratios and Formula | 2019 | 2018 |
|
Receivables turnover: |
Table (11)
Note: Since, the beginning value of receivable for 2018 is not given. So, the total amount of receivable for 2018 is assumed as average receivables.
Working Note:
(5) Determine the amount of average accounts receivable for 2019.
Thus, the accounts receivable turnover of Company K for 2019 and 2018 is 6.27 times and 5.47 times respectively.
l.
Compute inventory turnover of Company K for 2019 and 2018.
Explanation of Solution
Inventory Turnover Ratio: This ratio is a financial metric used by a company to quantify the number of times inventory is used or sold during the accounting period. It is calculated by using the formula:
Compute inventory turnover of Company K for 2019 and 2018:
| Ratios and Formula | 2019 | 2018 |
|
Inventory turnover: |
Table (12)
Note: Since, the beginning value of inventory for 2018 is not given. So, the total amount of inventory for 2018 is assumed as average inventory.
Working Note:
(6) Determine the amount of average inventory for 2019.
Thus, the inventory turnover of Company K for 2019 and 2018 is 1.28 times and 1.07 times respectively.
m.
Compute debt to equity ratio of Company K for 2019 and 2018.
Explanation of Solution
Debt–to-equity ratio: The debt-to-equity ratio indicates that the company’s debt as a proportion of its stockholders’ equity. The debt-to-equity ratio is calculated using the formula:
Compute debt to equity ratio of Company K for 2019 and 2018:
| Ratios and Formula | 2019 | 2018 |
|
Debt to equity ratio: |
Table (13)
Thus, the debt to equity ratio of Company K for 2019 and 2018 is 0.85:1 and 1.26:1 respectively.
n.
Compute debt to assets ratio of Company K for 2019 and 2018.
Explanation of Solution
Debt to assets ratio: The debt to asset ratio shows the relationship between total asset and the total liability of the company. Debt ratio reflects the financial strategy of the company. It is used to measure the percentage of company’s assets that are financed by long term debts. Debt to assets ratio is calculated by using the formula:
Compute debt to assets ratio of Company K for 2019 and 2018:
| Ratios and Formula | 2019 | 2018 |
|
Debt to assets ratio: |
Table (14)
Thus, the debt to assets ratio of Company K for 2019 and 2018 is 45.89% and 55.73% respectively.
Want to see more full solutions like this?
Chapter 9 Solutions
GEN COMBO LOOSELEAF SURVEY OF ACCOUNTING; CONNECT ACCESS CARD


- Sales transactions Using transactions listed in P4-2, indicate the effects of each transaction on the liquidity metric working capital and profitability metric gross profit percent. Indicate the gross profit percent for each sale (rounding to one decimal place) in parentheses next to the effect of the sale on the company’s ability to attain an overall gross profit percent of 30%.arrow_forwardVertical analysis The condensed income statements through income from operations for Dell Inc. and Apple Inc. for recent fiscal years follow (numbers in millions of dollars): Prepare comparative common-sized statements, rounding percents to one decimal place. Interpret the analyses.arrow_forwardRATIO ANALYSIS Data for Barry Computer Co. and its industry averages follow. a. Calculate the indicated ratios for Barry. b. Construct the DuPont equation for both Barry and the industry. c. Outline Barrys strengths and weaknesses as revealed by your analysis. d. Suppose Barry had doubled its sales as well as its inventories, accounts receivable, and common equity during 2015. How would that information affect the validity of your ratio analysis? (Hint: Think about averages and the effects of rapid growth on ratios if averages are not used. No calculations are needed.) Barry Computer Company: Balance Sheet as of December 31, 2015 (in Thousands) Cash 77,500 Accounts payable 129,000 Receivables 336,000 Other current liabilities 117,000 Inventories 241,500 Notes payable to bank 84,000 Total current assets 655,000 Total current liabilities 330,000 Long-term debt 256,500 Net fixed assets 292,500 Common equity 361,000 Total assets 947,500 Total liabilities and equity 947,500 Barry Computer Company: Income Statement for Year Ended December 31, 2015 (in Thousands) Sales 1,607,500 Cost of goods sold Materials 717,000 Labor 453,000 Heat, light, and power 68,000 Indirect labor 113,000 Depreciation 41,500 1,392,500 Gross profit 215,000 Selling expenses 115,000 General and administrative expenses 30,000 Earnings before interest and taxes (EBIT) 70,000 Interest expense 24,500 Earnings before taxes (EBT) 45,500 Federal and state income taxes (40%) 18,200 Net income 27,300 Ratio Barry Industry Average Current _____ 2.0 Quick _____ 1.3 Days sales outstandinga _____ 35 days Inventory turnover _____ 6.7 aCalculation is based on a 365-day year Total assets turnover _____ 3.0 Profit margin _____ 1.20% ROA _____ 0 ROE _____ 9.00% ROIC _____ 0 TIE _____ 3.0 Debt/Total capital _____ 47.00%arrow_forward
- RATIO ANALYSIS Data for Barry Computer Co. and its industry averages follow. a. Calculate the indicated ratios for Barry. b. Construct the DuPont equation for both Barry and the industry. c. Outline Barrys strengths and weaknesses as revealed by your analysis. d. Suppose Barry had doubled its sales as well as its inventories, accounts receivable, and common equity during 2014. How would that information affect the validity of your ratio analysis? (Hint: Think about averages and the effects of rapid growth on ratios if averages are not used. No calculations are needed.) Barry Computer Company: Balance Sheet as of December 31, 2014 (in Thousands) Cash 77,500 Accounts payable 129,000 Receivables 336,000 Other current liabilities 117,000 Inventories 241,500 Notes payable to bank 84,000 Total current assets 655,000 Total current liabilities 330,000 Long-term debt 256,500 Net fixed assets 292,500 Common equity 361,000 Total assets 947,500 Total liabilities and equity 947,500 Barry Computer Company: Income Statement for Year Ended December 31, 2014 (in Thousands) Sales 1,607,500 Cost of goods sold Materials 717,000 Labor 453,000 Heat, light, and power 68,000 Indirect labor 113,000 Depredation 41,500 1,392,500 Gross profit 215,000 Selling expenses 115,000 General and administrative expenses 30,00 Earnings before interest and taxes (EBIT) 70,000 Interest expense 24,500 Earnings before taxes (EBT) 45,500 Federal and state income taxes (40%) 18,200 Net income 27,300 Ratio Barry Industry Average Current ___ 2.0x Quick ___ 1.3x Days sales outstandinga ___ 35 days Inventory turnover ___ 6.7x Total assets turnover ___ 3.0x Profit margin ___ 12% aCalculation is based on a 365 day year. Ratio Barry Industry Average ROA ___ 3.6% ROE ___ 9.0% ROIC ___ 7.5% TIE ___ 3.0x Debt/Total capital ___ 47.0%arrow_forwardRATIO ANALYSIS Data for Barry Computer Co. and its industry averages follow. a. Calculate the indicated ratios for Barry. b. Construct the DuPont equation for both Barry and the industry. c. Outline Barrys strengths and weaknesses as revealed by your analysis. d. Suppose Barry had doubled its sales as well as its inventories, accounts receivable, and common equity during 2016. How would that information affect the validity of your ratio analysis? (Hint: Think about averages and the effects of rapid growth on ratios if averages are not used. No calculations are needed.) Ratio Barry Industry Average Current ----- 2.0 Quick ----- 13 Days sales outstandinga ----- 35 days Inventory turnover ----- 6.7 Total assets turnover ----- 3.0 Profit margin ----- 1.2% ROA ------ 3.6% ROE ----- 9.0% ROIC ----- 73% TIE ----- 3.0 Debt/Total capital ----- 47.0% aCalculation is based on a 365-day year.arrow_forwardRATIO ANALY SIS OF COMPARATI VE FIN ANCIAL STATE MENT S Refer to the financial statements in Problem 24-8B. REQUIRED Calculate the following ratios and amounts for 20-1 and 20-2 (round all calculations to two decimal places). (a) Return on assets (Total assets on January 1, 20-1, were 111,325.) (b) Return on common stockholders equity (Total common stockholders equity on January 1, 20-1, was 82,008.) (c) Earnings per share of common stock (The average numbers of shares outstanding were 6,300 shares in 20-1 and 6,900 in 20-2.) (d) Book value per share of common stock (e) Quick ratio (f) Current ratio (g) Working capital (h) Receivables turnover and average collection period (Net receivables on January 1, 20-1, were 28,995.) (i) Merchandise inventory turnover and average number of days to sell inventory (Merchandise inventory on January 1, 20-1, was 32,425.) (j) Debt-to-equity ratio (k) Asset turnover (Assets on January 1, 20-1, were 111,325.) (l) Times interest earned ratio (m) Profit margin ratio (n) Assets-to-equity ratio (o) Price-earnings ratio (The market price of the common stock was 120.00 and 110.00 on December 31, 20-2 and 20-1, respectively.)arrow_forward
 College Accounting, Chapters 1-27AccountingISBN:9781337794756Author:HEINTZ, James A.Publisher:Cengage Learning,
 Accounting (Text Only)AccountingISBN:9781285743615Author:Carl Warren, James M. Reeve, Jonathan DuchacPublisher:Cengage Learning
 Cornerstones of Financial AccountingAccountingISBN:9781337690881Author:Jay Rich, Jeff JonesPublisher:Cengage Learning
 Fundamentals of Financial Management (MindTap Cou...FinanceISBN:9781285867977Author:Eugene F. Brigham, Joel F. HoustonPublisher:Cengage Learning
 Fundamentals of Financial Management, Concise Edi...FinanceISBN:9781285065137Author:Eugene F. Brigham, Joel F. HoustonPublisher:Cengage Learning
 Fundamentals of Financial Management, Concise Edi...FinanceISBN:9781305635937Author:Eugene F. Brigham, Joel F. HoustonPublisher:Cengage Learning