
Concept explainers
Videos
Ethical Behavior of Business Students at Bayview University
During the global recession of 2008 and 2009, there were many accusations of unethical behavior by Wall Street executives, financial managers, and other corporate officers. At that time, an article appeared that suggested that part of the reason for such unethical business behavior may stem from the fact that cheating has become more prevalent among business students (Chronicle of Higher Education, February 10, 2009). The article reported that 56% of business students admitted to cheating at some time during their academic career as compared to 47% of nonbusiness students.
Cheating has been a concern of the dean of the College of Business at Bayview University for several years. Some faculty members in the college believe that cheating is more widespread at Bayview than at other universities, while other faculty members think that cheating is not a major problem in the college. To resolve some of these issues, the dean commissioned a study to assess the current ethical behavior of business students at Bay-view. As part of this study, an anonymous exit survey was administered to a sample of 90 business students from this year’s graduating class. Responses to the following questions were used to obtain data regarding three types of cheating.
During your time at Bayview, did you ever present work copied off the Internet as your own?
Yes ______ No ______
During your time at Bayview, did you ever copy answers off another student’s exam?
Yes ________ No _______
During your time at Bayview, did you ever collaborate with other students on projects that were supposed to be completed individually?
Yes ________ No _______
Any student who answered Yes to one or more of these questions was considered to have been involved in some type of cheating. A portion of the data collected follows. The complete data set is in the file named Bayview.
| Student | Copied from Internet | Copied on Exam | Collaborated on Individual project | Gender |
| 1 | No | No | No | Female |
| 2 | No | No | No | Male |
| 3 | Yes | No | Yes | Male |
| 4 | Yes | Yes | No | Male |
| 5 | No | No | Yes | Male |
| 6 | Yes | No | No | Female |
| . | . | . | . | . |
| . | . | . | . | . |
| 88 | No | No | No | Male |
| 89 | No | Yes | Yes | Male |
| 90 | No | No | No | Female |
Managerial Report
Prepare a report for the dean of the college that summarizes your assessment of the nature of cheating by business students at Bayview University. Be sure to include the following items in your report.
- 1. Use
descriptive statistics to summarize the data and comment on your findings. - 2. Develop 95% confidence intervals for the proportion of all students, the proportion of male students, and the proportion of female students who were involved in some type of cheating.
- 3. Conduct a hypothesis test to determine if the proportion of business students at Bayview University who were involved in some type of cheating is less than that of business students at other institutions as reported by the Chronicle of Higher Education.
- 4. Conduct a hypothesis test to determine if the proportion of business students at Bay-view University who were involved in some form of cheating is less than that of non-business students at other institutions as reported by the Chronicle of higher Education.
- 5. What advice would you give to the dean based upon your analysis of the data?
1.
Summarize the data and comment on your findings using the descriptive statistics.
Answer to Problem 2CP
The percentage of males is greater in Copied from Internet, Copied on Exam, and Collaborated on Individual Project compared to females.
Explanation of Solution
Calculation:
The given data is based on the assessment of the nature of cheating by a business student at Bayview University.
Software procedure:
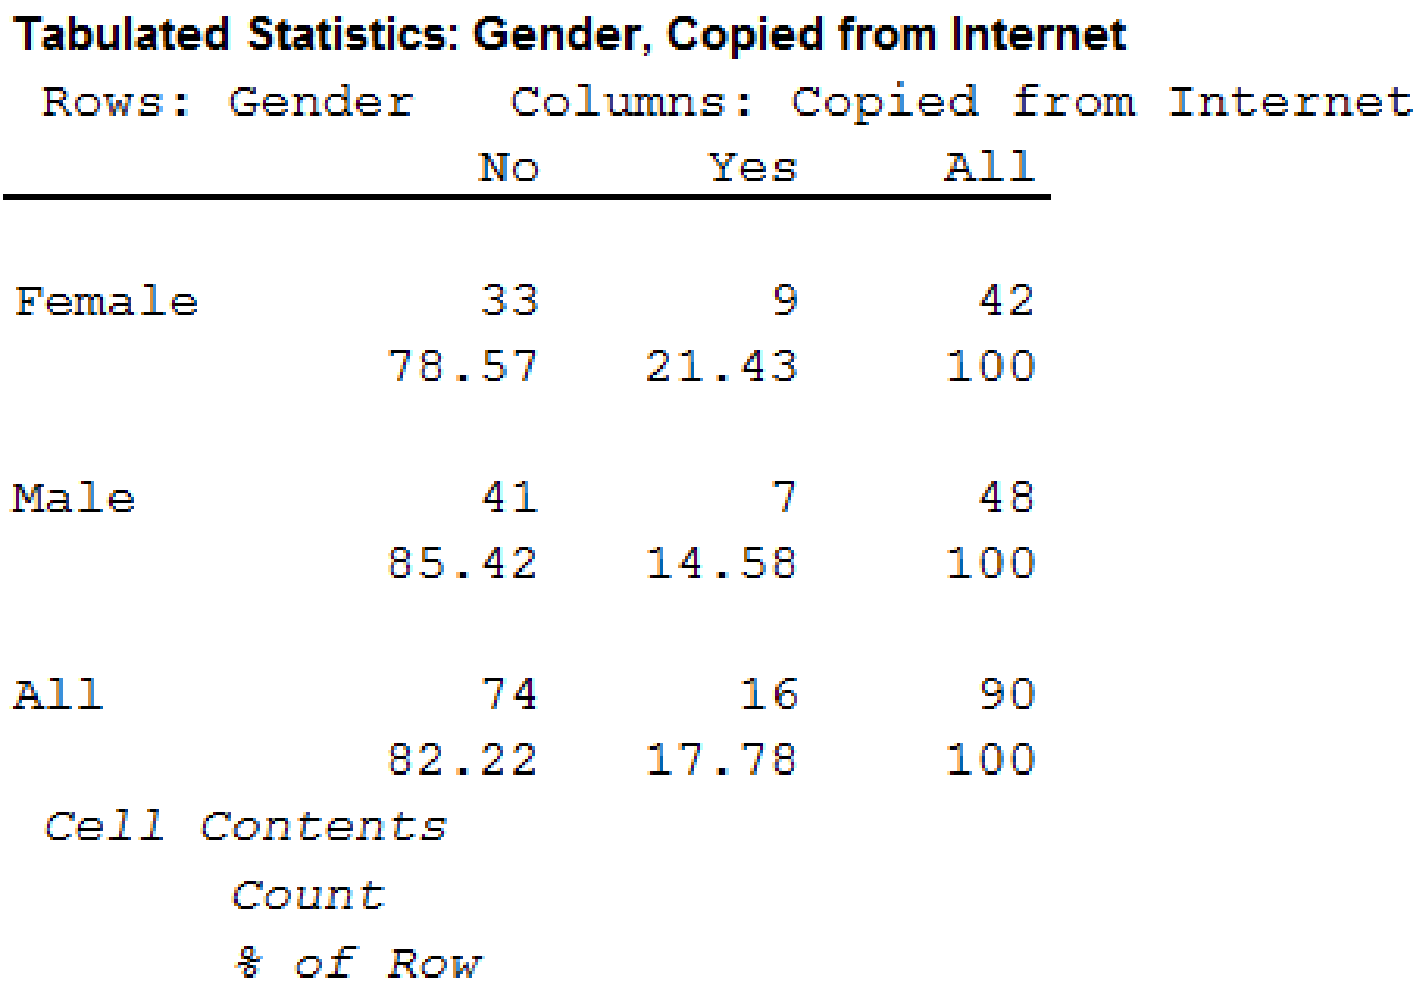
A step-by-step procedure to construct a contingency table or cross table for gender and Copied from Internet using MINITAB software given below:
- Choose stat > tables>cross tabulation and chi square.
- Choose raw data (summarized).
- In rows, enter the column of Gender.
- In columns, enter the column of Copied from Internet.
- Under display, select count
- Click OK
Output using MINITAB software is given below:
Software procedure:
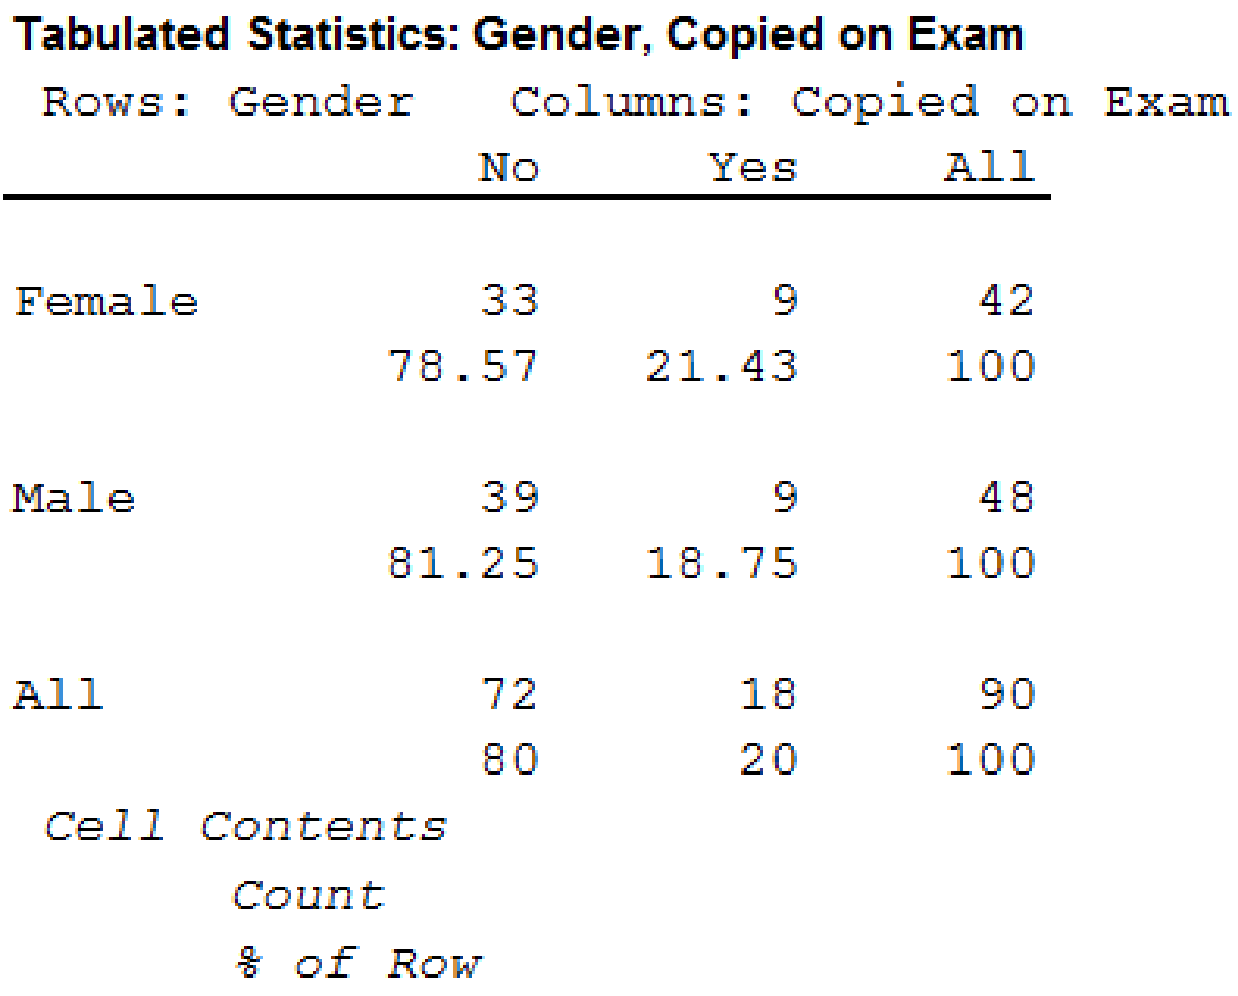
A step-by-step procedure to construct a contingency table or cross table for gender and Copied on Exam using MINITAB software given below:
- Choose stat > tables>cross tabulation and chi square.
- Choose raw data (summarized).
- In rows, enter the column of Gender.
- In columns, enter the column of Copied on Exam.
- Under display, select count
- Click OK
Output using MINITAB software is given below:
Software procedure:
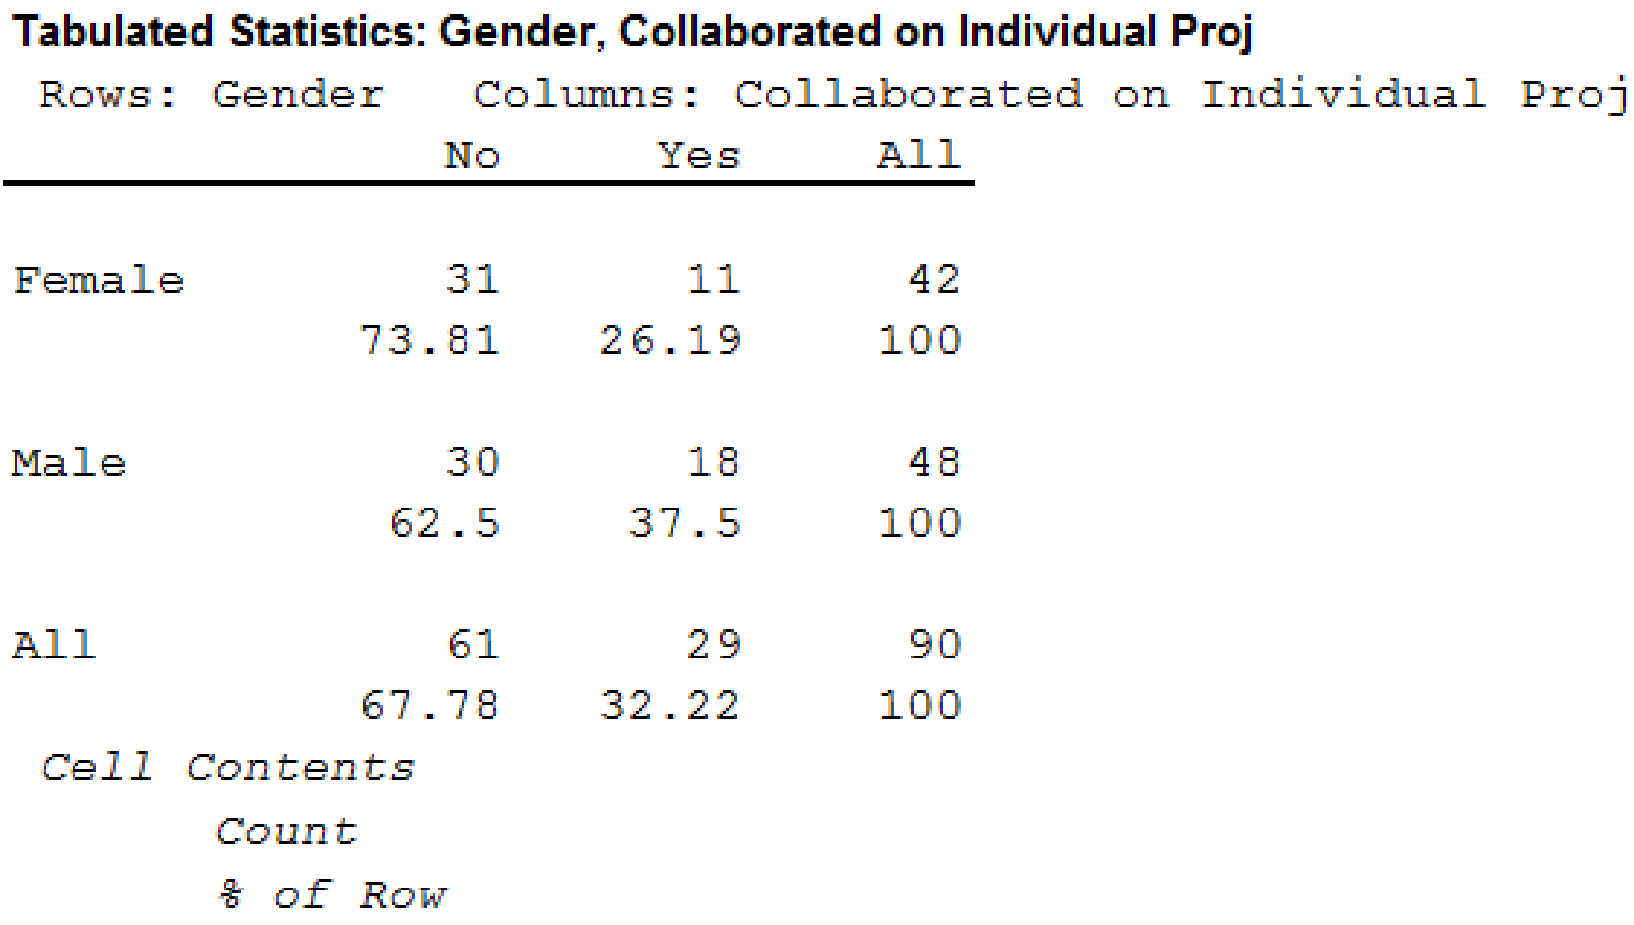
A step-by-step procedure to construct a contingency table or cross table for gender and Collaborated on Individual Project using MINITAB software given below:
- Choose stat > tables>cross tabulation and chi square.
- Choose raw data (summarized).
- In rows, enter the column of Gender.
- In columns, enter the column of Collaborated on Individual Project.
- Under display, select count
- Click OK
Output using MINITAB software is given below:
From the results, the summary table for all students who were involved in type of cheating is shown below:
| Copied from Internet | Copied on Exam | Collaborated on Individual Project | Overall Cheated | |||||
| Count | % | Count | % | Count | % | Count | % | |
| Yes | 16 | 17.778 | 18 | 20 | 29 | 32.222 | 37 | 41.111 |
| No | 74 | 82.222 | 72 | 80 | 61 | 67.778 | 53 | 58.889 |
| 90 | 100 | 90 | 100 | 90 | 100 | 90 | 100 | |
From the results, the summary table for male students who were involved in type of cheating is shown below:
| Copied from Internet | Copied on Exam | Collaborated on Individual Project | Overall Cheated | |||||
| Count | % | Count | % | Count | % | Count | % | |
| Yes | 7 | 14.583 | 9 | 18.75 | 18 | 37.5 | 21 | 43.75 |
| No | 41 | 85.417 | 39 | 81.25 | 30 | 62.5 | 27 | 56.25 |
| 48 | 100 | 48 | 100 | 48 | 100 | 48 | 100 | |
From the results, the summary table for female students who were involved in type of cheating is shown below:
| Copied from Internet | Copied on Exam | Collaborated on Individual Project | Overall Cheated | |||||
| Count | % | Count | % | Count | % | Count | % | |
| Yes | 9 | 21.428 | 9 | 21.428 | 11 | 26.190 | 16 | 38.095 |
| No | 33 | 78.571 | 33 | 78.571 | 31 | 73.810 | 26 | 61.905 |
| 42 | 100 | 42 | 100 | 42 | 100 | 42 | 100 | |
Observation:
From the MINITAB output, the percentage of males is greater in Copied from Internet, Copied on Exam, and Collaborated on Individual Project compared to females.
2.
Find the 95% confidence intervals for the proportion of all students who were involved in some type of cheating.
Find the 95% confidence intervals for the proportion of male students who were involved in some type of cheating.
Find the 95% confidence intervals for the proportion of female students who were involved in some type of cheating.
Answer to Problem 2CP
The 95% confidence intervals for the proportion of all students who were involved in some type of cheating is
The 95% confidence intervals for the proportion of male students who were involved in some type of cheating is
The 95% confidence intervals for the proportion of female students who were involved in some type of cheating is
Explanation of Solution
Calculation:
Confidence interval:
Software Procedure:
A step-by-step procedure to obtain the confidence interval using MINITAB software:
- Choose Stat > Basic Statistics > 1 Proportion.
- Choose Summarized data.
- In Number of events, enter 37. In Number of trials, enter 90.
- Check Options; enter Confidence level as 95%.
- Choose not equal in alternative.
- Click OK.
Output using MINITAB software is given below:
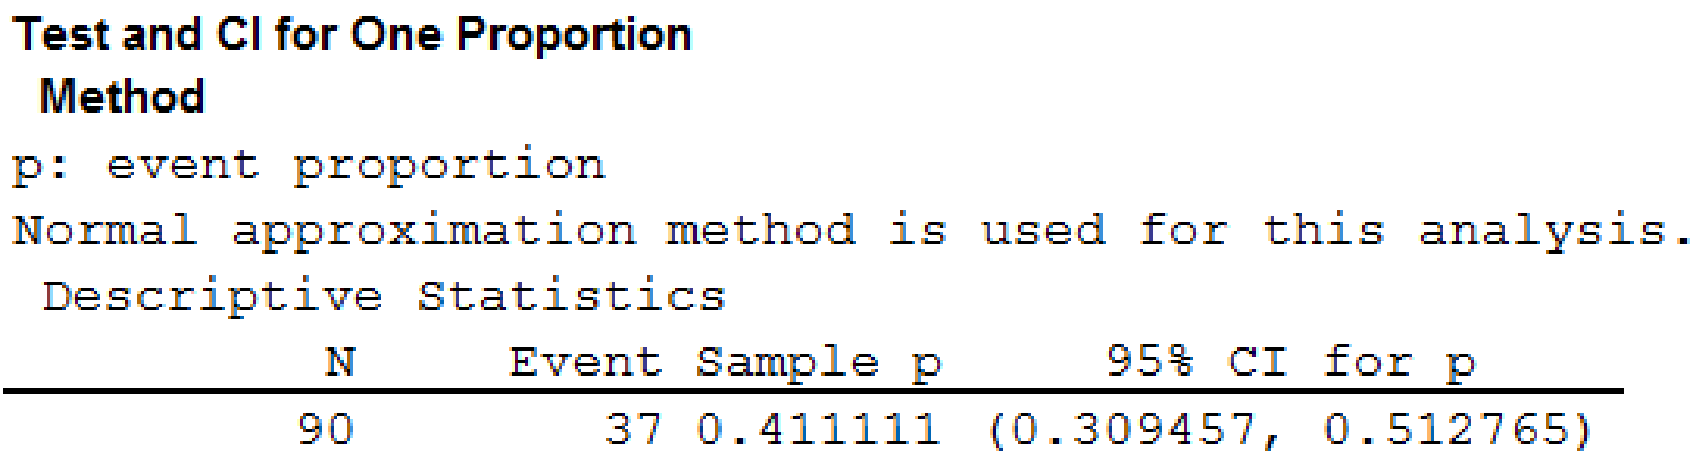
From the output, the 95% confidence intervals for the proportion of all students who were involved in some type of cheating is
Confidence interval:
Software Procedure:
A step-by-step procedure to obtain the confidence interval using MINITAB software:
- Choose Stat > Basic Statistics > 1 Proportion.
- Choose Summarized data.
- In Number of events, enter 21. In Number of trials, enter 48.
- Check Options; enter Confidence level as 95%.
- Choose not equal in alternative.
- Click OK.
Output using MINITAB software is given below:
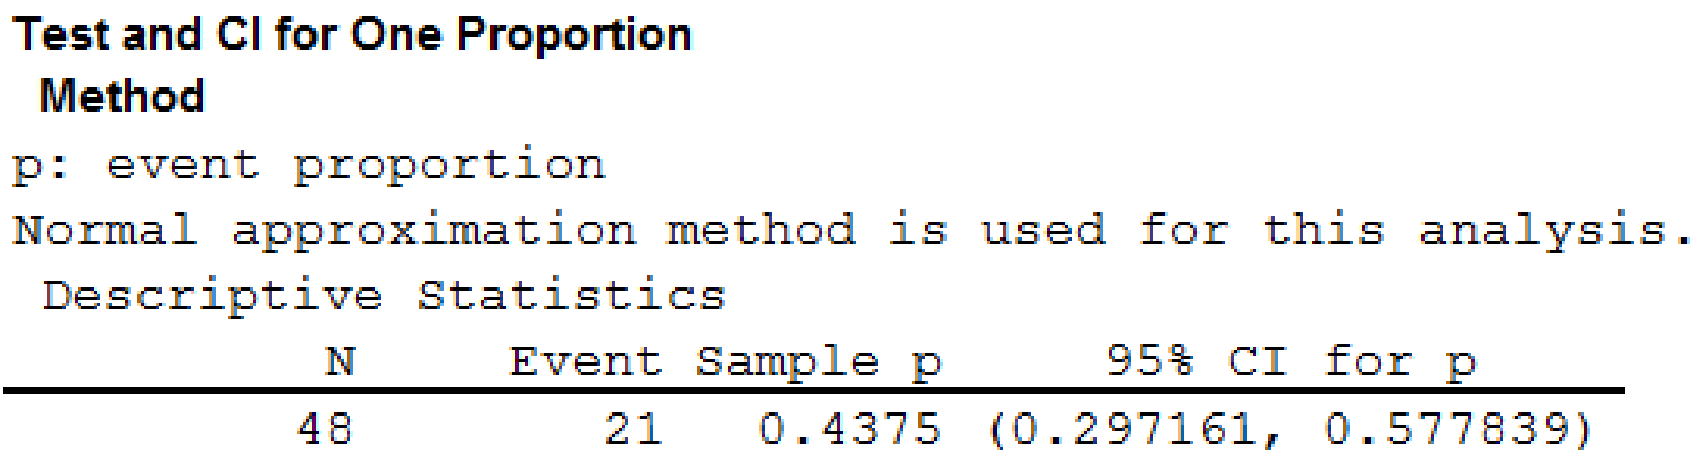
From the output, the 95% confidence intervals for the proportion of male students who were involved in some type of cheating is
Confidence interval:
Software Procedure:
A step-by-step procedure to obtain the confidence interval using MINITAB software:
- Choose Stat > Basic Statistics > 1 Proportion.
- Choose Summarized data.
- In Number of events, enter 16. In Number of trials, enter 42.
- Check Options; enter Confidence level as 95%.
- Choose not equal in alternative.
- Click OK.
Output using MINITAB software is given below:
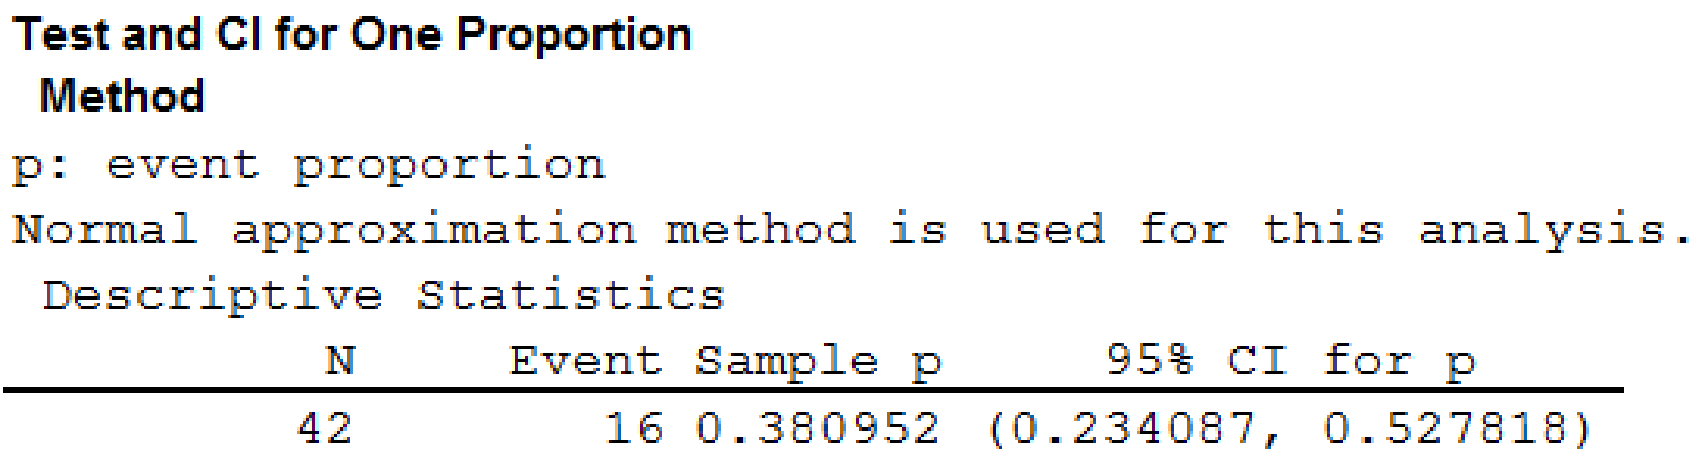
From the output, the 95% confidence intervals for the proportion of female students who were involved in some type of cheating is
3.
Check whether the proportion of business students at Bayview University who were involved in some type of cheating is less than that of business students at other institutions as reported by the Chronicle of Higher Education.
Answer to Problem 2CP
The conclusion is that the proportion of business students at Bayview University who were involved in some type of cheating is less than that of business students at other institutions as reported by the Chronicle of Higher Education.
Explanation of Solution
Calculation:
The null and alternative hypotheses are given below:
Null hypothesis:
Alternative hypothesis:
Software Procedure:
A step-by-step procedure to obtain the p-value using MINITAB software:
- Choose Stat > Basic Statistics > 1 Proportion.
- Choose Summarized data.
- In Number of events, enter 37. In Number of trials, enter 90.
- In Perform hypothesis test, enter the test proportion as 0.56.
- Check Options; enter Confidence level as 95%.
- Choose less than in alternative.
- Click OK.
Output using MINITAB software is given below:
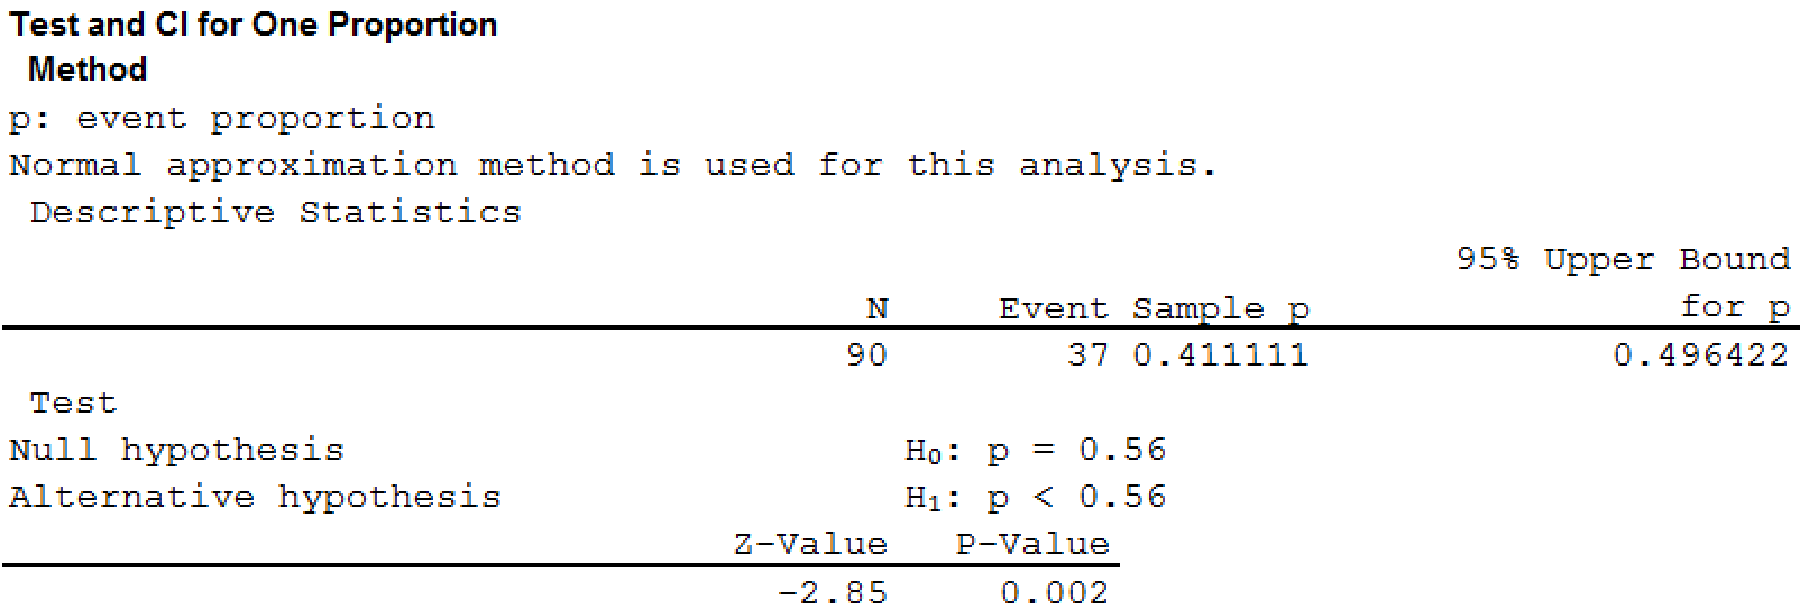
From the output, the p-value is 0.002.
Rejection rule:
If
If
Conclusion:
Here, the p-value is less than the level of significance.
That is,
By the rejection rule, the null hypothesis is rejected.
Hence, the proportion of business students at Bayview University who were involved in some type of cheating is less than that of business students at other institutions as reported by the Chronicle of Higher Education.
4.
Check whether the proportion of business students at Bayview University who were involved in some form of cheating is less than that of non-business students at other institutions as reported by the Chronicle of Higher Education.
Answer to Problem 2CP
The conclusion is that the proportion of business students at Bayview University who were involved in some form of cheating is not less than that of non-business students at other institutions as reported by the Chronicle of Higher Education.
Explanation of Solution
Calculation:
The null and alternative hypotheses most appropriate for this situation are shown below:
Null hypothesis:
Alternative hypothesis:
Software Procedure:
A step-by-step procedure to obtain the p-value using MINITAB software:
- Choose Stat > Basic Statistics > 1 Proportion.
- Choose Summarized data.
- In Number of events, enter 37. In Number of trials, enter 90.
- In Perform hypothesis test, enter the test proportion as 0.47.
- Check Options; enter Confidence level as 95%.
- Choose less than in alternative.
- Click OK.
Output using MINITAB software is given below:
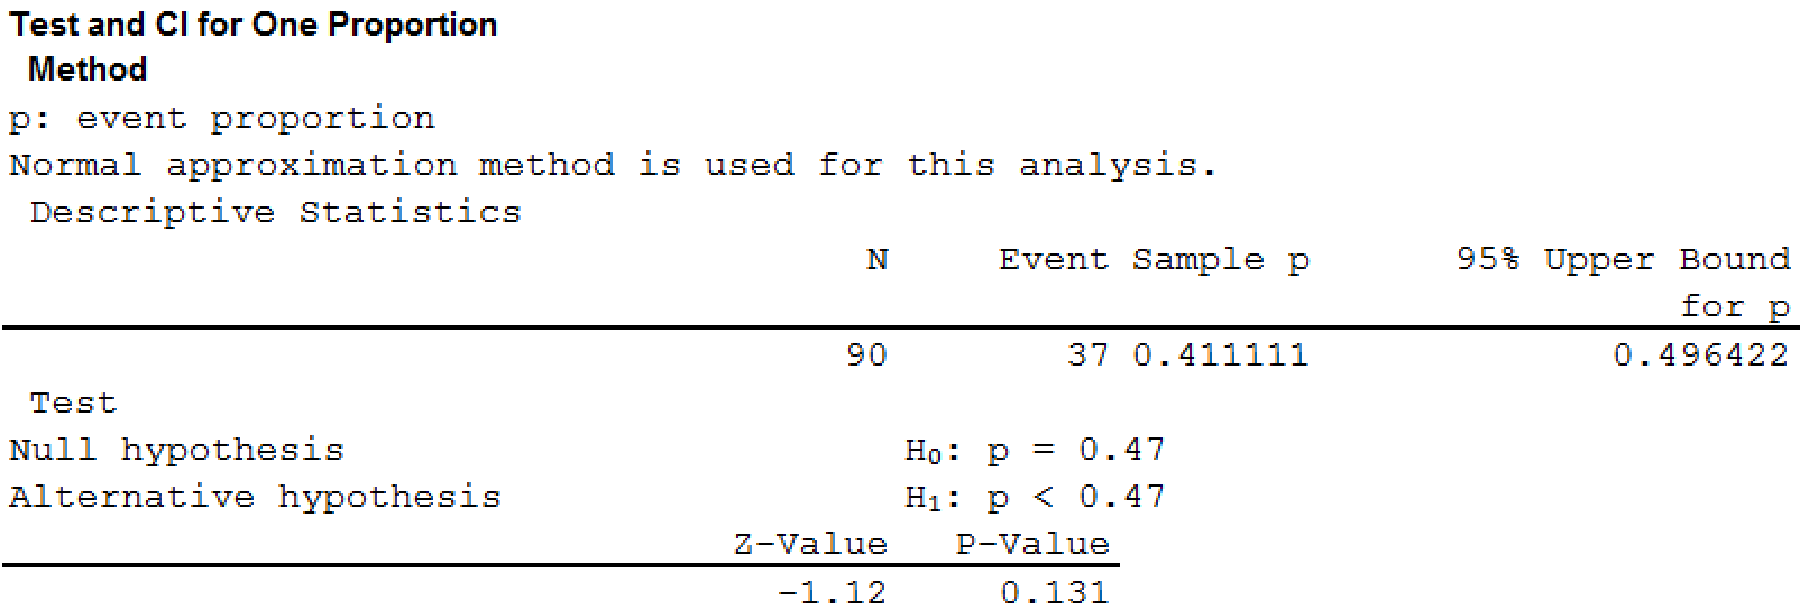
From the output, the p-value is 0.131.
Rejection rule:
If
If
Conclusion:
Here, the p-value is greater than the level of significance.
That is,
By the rejection rule, the null hypothesis is not rejected.
Hence, the proportion of business students at Bayview University who were involved in some form of cheating is not less than that of non-business students at other institutions as reported by the Chronicle of Higher Education.
5.
Find the advice that you give to the dean based upon your analysis of the data.
Explanation of Solution
From the results, it can be observed that the business students at Bayview University who were involved in some form of cheating are higher when compared to the non-business students. Hence, the dean identifies the reason that the student cannot handle the exam without cheating.
Want to see more full solutions like this?
Chapter 9 Solutions
Essentials Of Statistics For Business & Economics


 Functions and Change: A Modeling Approach to Coll...AlgebraISBN:9781337111348Author:Bruce Crauder, Benny Evans, Alan NoellPublisher:Cengage Learning
 Big Ideas Math A Bridge To Success Algebra 1: Stu...AlgebraISBN:9781680331141Author:HOUGHTON MIFFLIN HARCOURTPublisher:Houghton Mifflin Harcourt