
Videos
a)
To construct a boxplot
a)
Explanation of Solution
Given:
| 2 | 5 | ||
| 10 | 9 | ||
| 3 | 15 | ||
| 9 | 15 | ||
| 15 | 4 | ||
| 10 | 5 | ||
| 7 | 13 | ||
| 4 | 6 | ||
| 3 | 14 | ||
| 7 | 11 | ||
| 5 | 6 | ||
| 9 | 12 | ||
Boxplot for this data is,
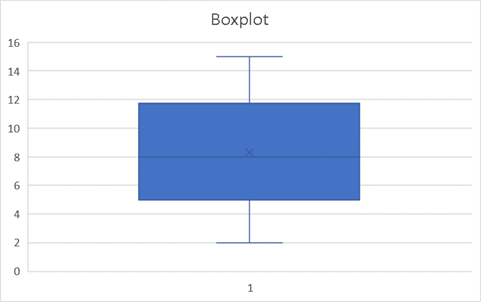
Above boxplot shows median is approximately middle of the box as well as tails of the box are at same distance from the box. So, this boxplot shows symmetry of the data. Hence it can be assumed that, this population follows approximately
Assumption of testing of hypothesis are satisfied
b)
To perform hypothesis testing
b)
Explanation of Solution
First need to find mean and standard deviation from the data.
Formula:
Mean:
Standard deviation:
Test statistic:
Calculation:
Creating table to find mean and sample standard deviation:
| X | ||
| 2 | -6.29 | 39.56 |
| 10 | 1.71 | 2.92 |
| 3 | -5.29 | 27.98 |
| 9 | 0.71 | 0.50 |
| 15 | 6.71 | 45.02 |
| 10 | 1.71 | 2.92 |
| 7 | -1.29 | 1.66 |
| 4 | -4.29 | 18.40 |
| 3 | -5.29 | 27.98 |
| 7 | -1.29 | 1.66 |
| 5 | -3.29 | 10.82 |
| 9 | 0.71 | 0.50 |
| 5 | -3.29 | 10.82 |
| 9 | 0.71 | 0.50 |
| 15 | 6.71 | 45.02 |
| 15 | 6.71 | 45.02 |
| 4 | -4.29 | 18.40 |
| 5 | -3.29 | 10.82 |
| 13 | 4.71 | 22.18 |
| 6 | -2.29 | 5.24 |
| 14 | 5.71 | 32.60 |
| 11 | 2.71 | 7.34 |
| 6 | -2.29 | 5.24 |
| 12 | 3.71 | 13.76 |
Mean:
Standard deviation:
From the data, sample mean is
Null and Alternative Hypotheses:
This corresponds to a left-tail test, for which a t-test for one mean, with unknown population standard deviation will be used.
t = -0.39
The number of degrees of freedom are df = n-1 = 24-1=23
Rejection Region:
Given significance level = a = 0.05 and df = 23
So Critical Value for the test is,
Decision:
Since it is observed that |t| = 0.39<
It is then concluded that the Null Hypothesis is not rejected.
Conclusion: It is concluded that the Null Hypothesis is not rejected. Therefore, there is not enough evidence to claim that the Mean number of runs in 2013 is less than it was in 2012 at the 0.05 significance level
Want to see more full solutions like this?
Chapter 9 Solutions
ELEMENTARY STATISTICS-ACCESS CARD PKG


 MATLAB: An Introduction with ApplicationsStatisticsISBN:9781119256830Author:Amos GilatPublisher:John Wiley & Sons Inc
 Probability and Statistics for Engineering and th...StatisticsISBN:9781305251809Author:Jay L. DevorePublisher:Cengage Learning
 Statistics for The Behavioral Sciences (MindTap C...StatisticsISBN:9781305504912Author:Frederick J Gravetter, Larry B. WallnauPublisher:Cengage Learning
 Elementary Statistics: Picturing the World (7th E...StatisticsISBN:9780134683416Author:Ron Larson, Betsy FarberPublisher:PEARSON
 The Basic Practice of StatisticsStatisticsISBN:9781319042578Author:David S. Moore, William I. Notz, Michael A. FlignerPublisher:W. H. Freeman
 Introduction to the Practice of StatisticsStatisticsISBN:9781319013387Author:David S. Moore, George P. McCabe, Bruce A. CraigPublisher:W. H. Freeman