
a)
To identify: The decision that would minimize the expected cost using precision tree.
Introduction: Simulation model is the digital prototype of the physical model that helps to
a)
Explanation of Solution

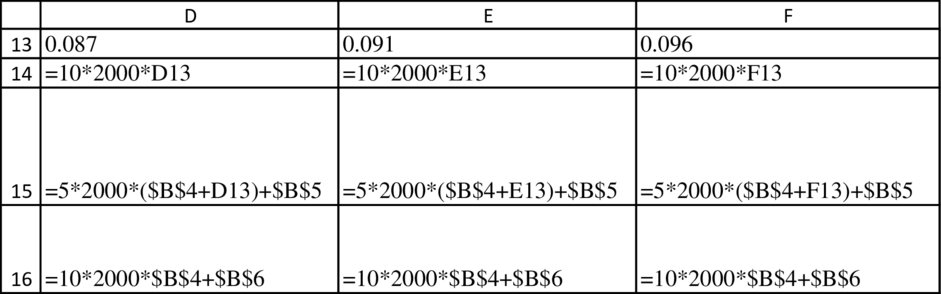
Formulae to determine the above table:
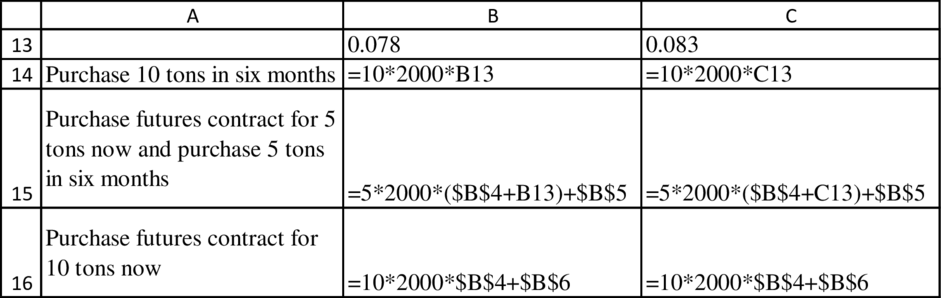

b)
To determine: The input that have the largest effect on the best.
Introduction: Simulation model is the digital prototype of the physical model that helps to forecast the performance of the system or model in the real world.
b)
Explanation of Solution
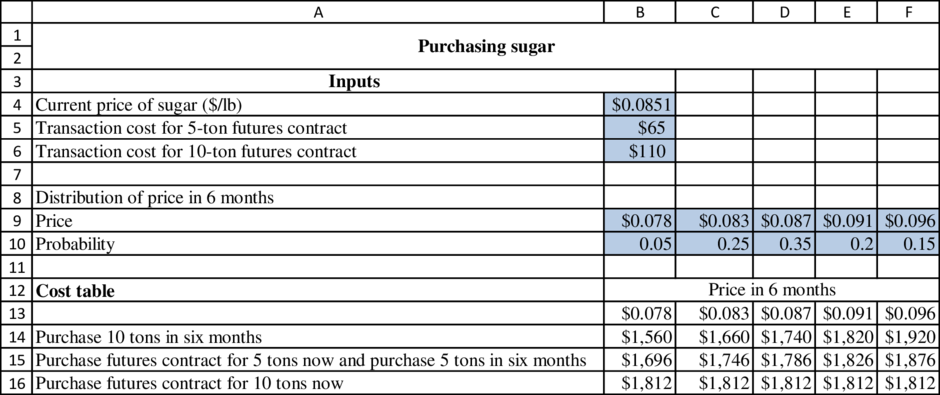
Formulae to determine the above table:

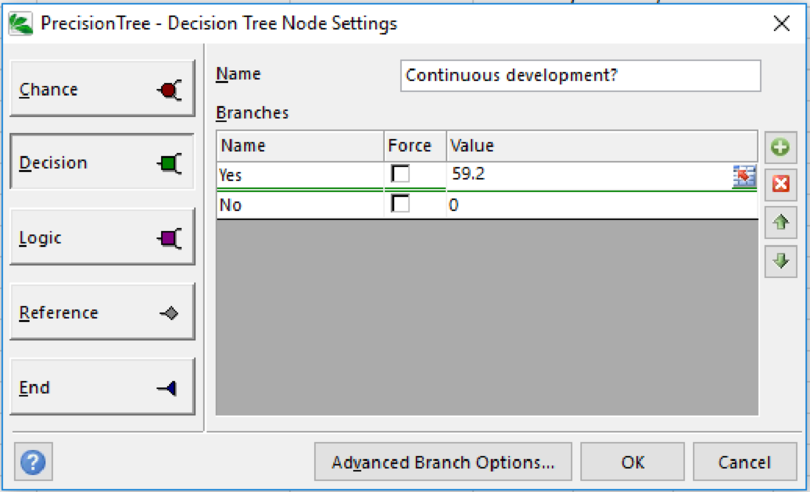
Decision tree developed by precision tree software:
Decision tree should be developed using precision tree software.
Place the cursor at any blank cell and click decision tree under precision tree icon. The following window will appear:
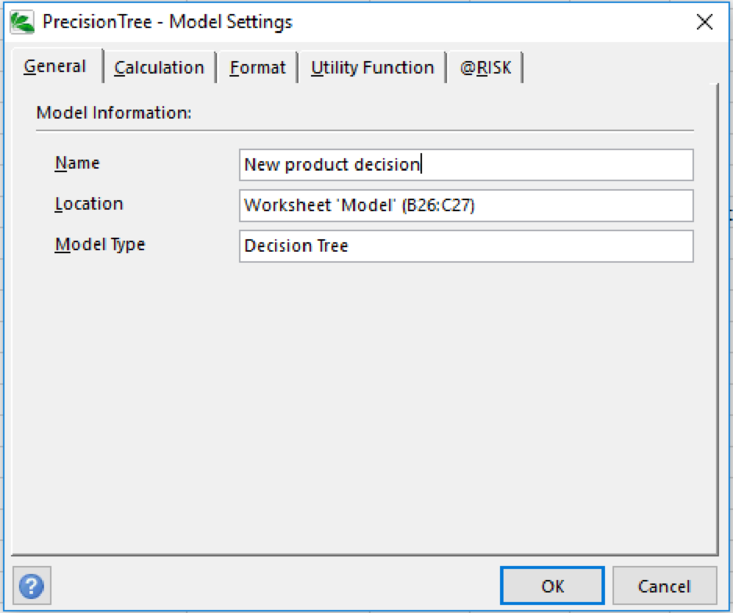
Press ok and the below image (Model image) will appear:
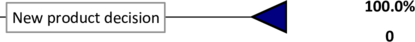
Click in the triangle:
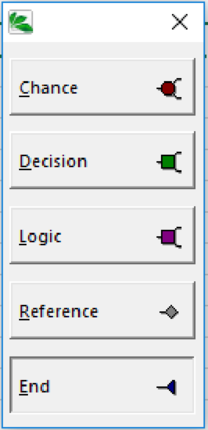
Select decision (The below image is model):
Click ok and the below image (Model image) will appear:
Click in the triangle:

Select chance (The below image is model):
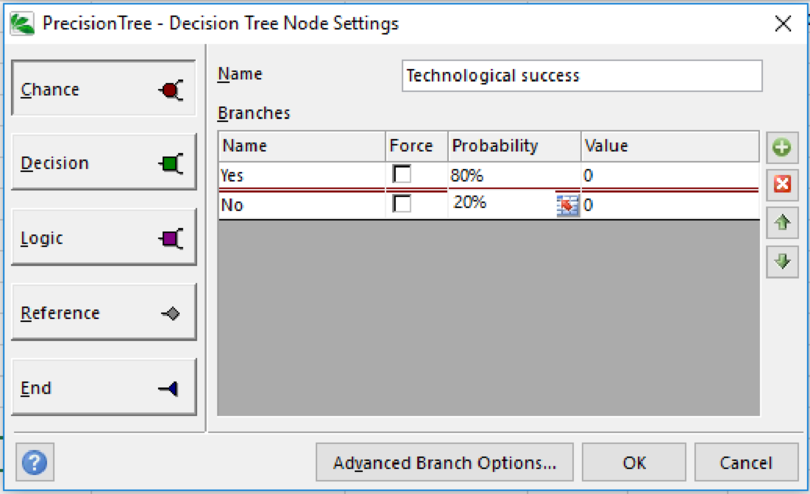
The process should be continued till end.
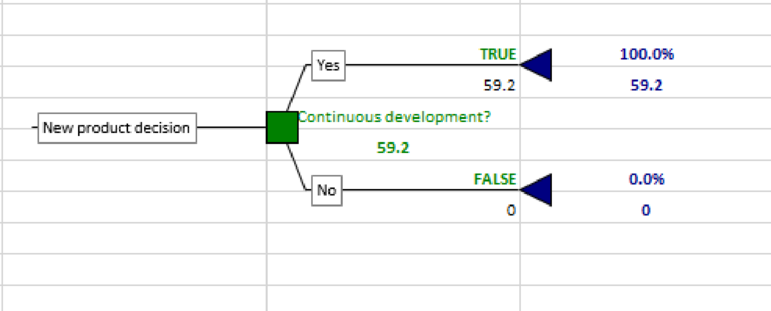
The following image shows the complete decision tree:
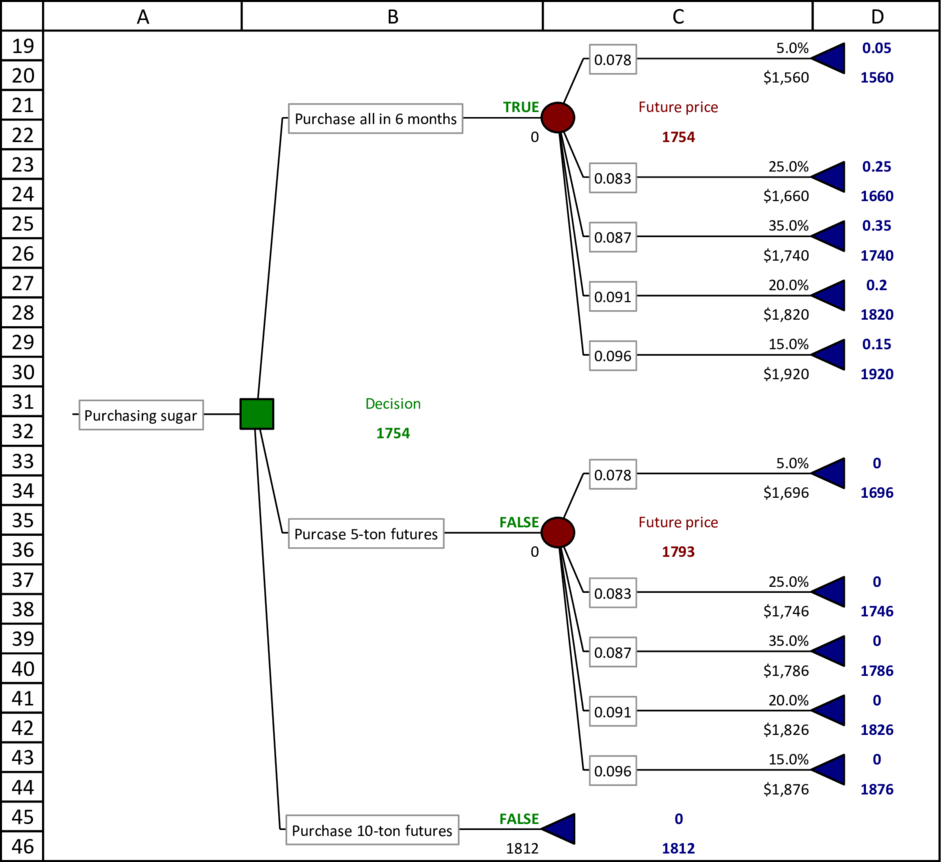
According to decision tree, it is better to wait and purchase the sugar in six months.
Strategy B4:
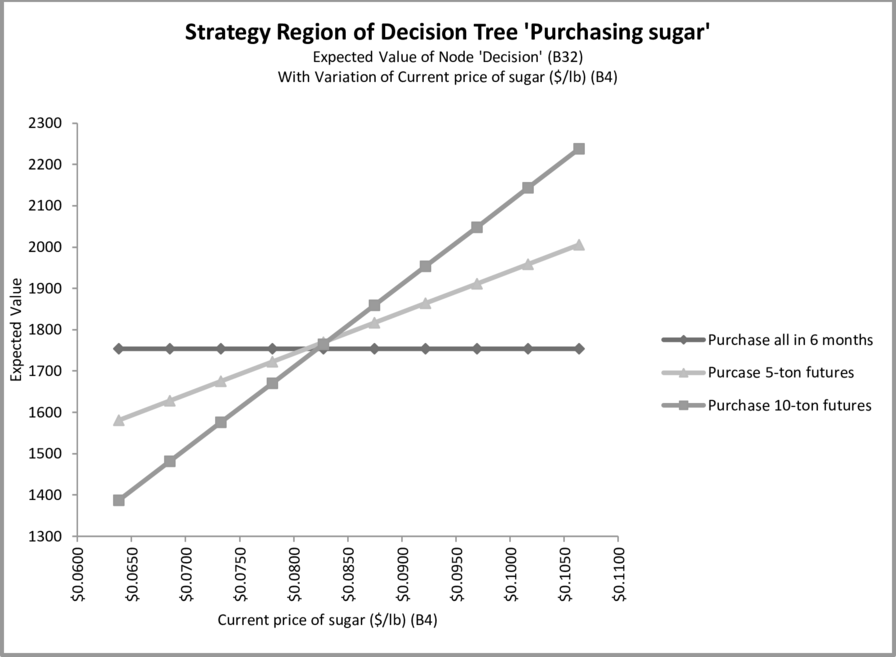
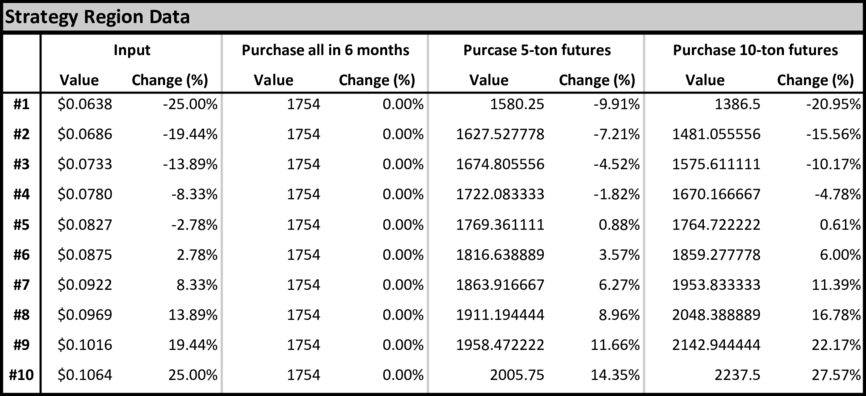
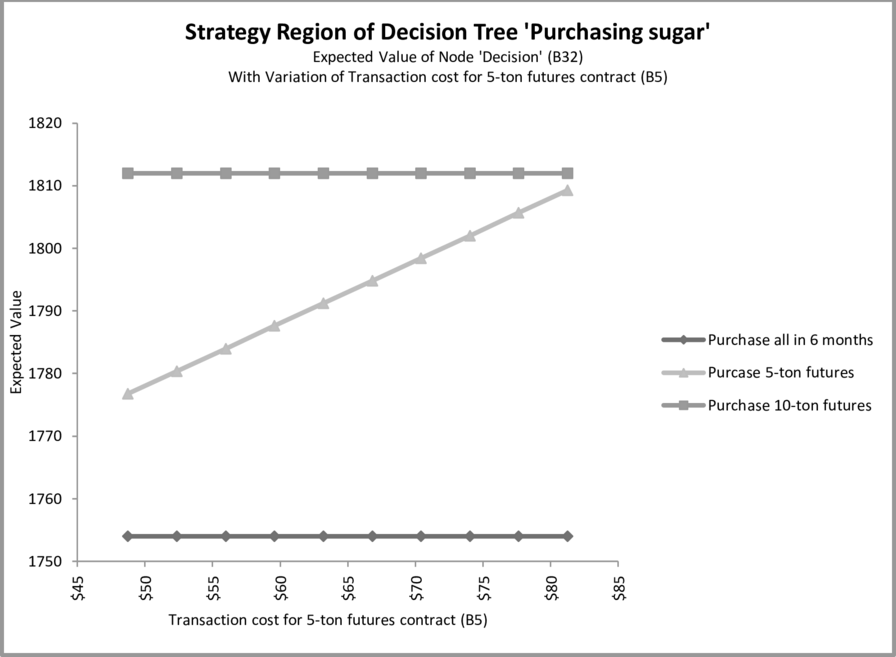
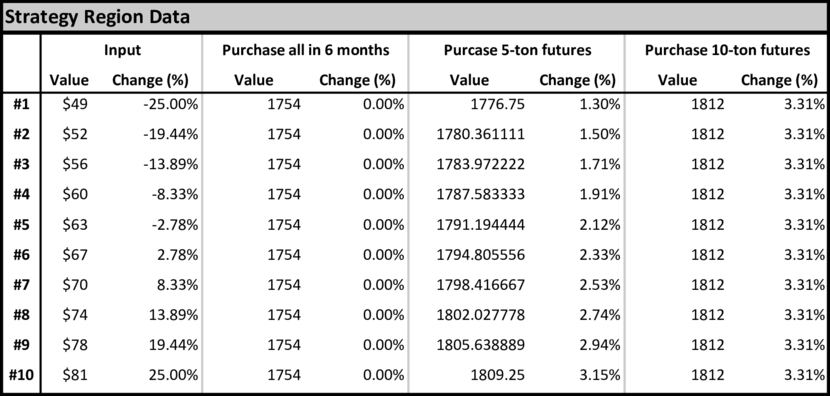
Strategy B5:
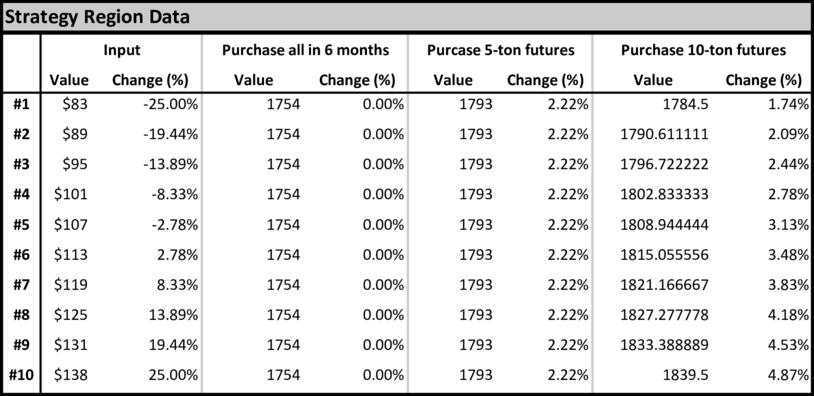
Strategy B6:
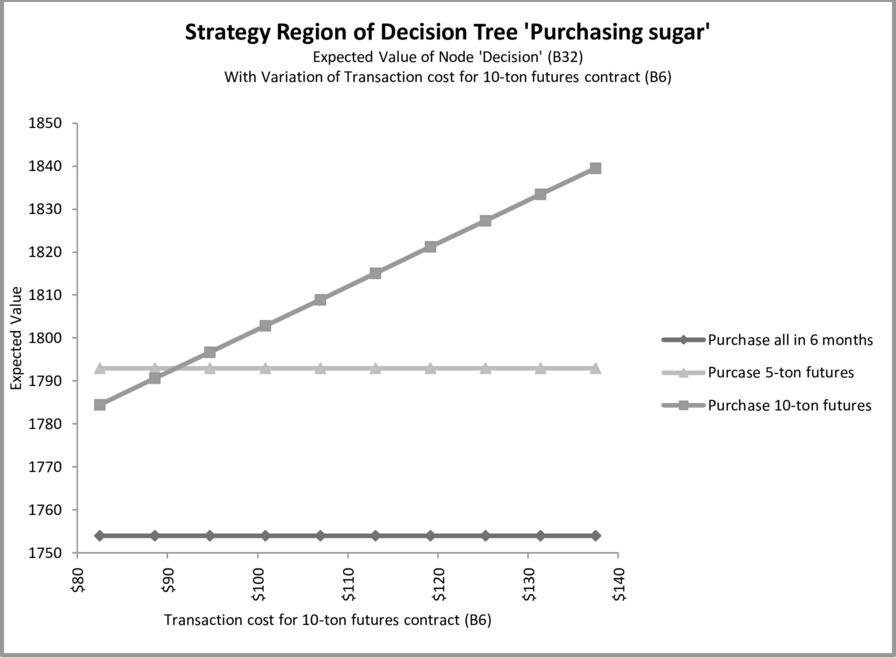
The sensitivity analysis was done for the cells B4, B5, and B6. It is optimal to purchase a 10-ton futures contract.
Want to see more full solutions like this?
Chapter 9 Solutions
PRACTICAL MGT. SCIENCE (LL)-W/MINDTAP

- A common decision is whether a company should buy equipment and produce a product in house or outsource production to another company. If sales volume is high enough, then by producing in house, the savings on unit costs will cover the fixed cost of the equipment. Suppose a company must make such a decision for a four-year time horizon, given the following data. Use simulation to estimate the probability that producing in house is better than outsourcing. If the company outsources production, it will have to purchase the product from the manufacturer for 25 per unit. This unit cost will remain constant for the next four years. The company will sell the product for 42 per unit. This price will remain constant for the next four years. If the company produces the product in house, it must buy a 500,000 machine that is depreciated on a straight-line basis over four years, and its cost of production will be 9 per unit. This unit cost will remain constant for the next four years. The demand in year 1 has a worst case of 10,000 units, a most likely case of 14,000 units, and a best case of 16,000 units. The average annual growth in demand for years 2-4 has a worst case of 7%, a most likely case of 15%, and a best case of 20%. Whatever this annual growth is, it will be the same in each of the years. The tax rate is 35%. Cash flows are discounted at 8% per year.arrow_forwardIn the financial world, there are many types of complex instruments called derivatives that derive their value from the value of an underlying asset. Consider the following simple derivative. A stocks current price is 80 per share. You purchase a derivative whose value to you becomes known a month from now. Specifically, let P be the price of the stock in a month. If P is between 75 and 85, the derivative is worth nothing to you. If P is less than 75, the derivative results in a loss of 100(75-P) dollars to you. (The factor of 100 is because many derivatives involve 100 shares.) If P is greater than 85, the derivative results in a gain of 100(P-85) dollars to you. Assume that the distribution of the change in the stock price from now to a month from now is normally distributed with mean 1 and standard deviation 8. Let EMV be the expected gain/loss from this derivative. It is a weighted average of all the possible losses and gains, weighted by their likelihoods. (Of course, any loss should be expressed as a negative number. For example, a loss of 1500 should be expressed as -1500.) Unfortunately, this is a difficult probability calculation, but EMV can be estimated by an @RISK simulation. Perform this simulation with at least 1000 iterations. What is your best estimate of EMV?arrow_forwardYou now have 10,000, all of which is invested in a sports team. Each year there is a 60% chance that the value of the team will increase by 60% and a 40% chance that the value of the team will decrease by 60%. Estimate the mean and median value of your investment after 50 years. Explain the large difference between the estimated mean and median.arrow_forward
- Amanda has 30 years to save for her retirement. At the beginning of each year, she puts 5000 into her retirement account. At any point in time, all of Amandas retirement funds are tied up in the stock market. Suppose the annual return on stocks follows a normal distribution with mean 12% and standard deviation 25%. What is the probability that at the end of 30 years, Amanda will have reached her goal of having 1,000,000 for retirement? Assume that if Amanda reaches her goal before 30 years, she will stop investing. (Hint: Each year you should keep track of Amandas beginning cash positionfor year 1, this is 5000and Amandas ending cash position. Of course, Amandas ending cash position for a given year is a function of her beginning cash position and the return on stocks for that year. To estimate the probability that Amanda meets her goal, use an IF statement that returns 1 if she meets her goal and 0 otherwise.)arrow_forwardThe Tinkan Company produces one-pound cans for the Canadian salmon industry. Each year the salmon spawn during a 24-hour period and must be canned immediately. Tinkan has the following agreement with the salmon industry. The company can deliver as many cans as it chooses. Then the salmon are caught. For each can by which Tinkan falls short of the salmon industrys needs, the company pays the industry a 2 penalty. Cans cost Tinkan 1 to produce and are sold by Tinkan for 2 per can. If any cans are left over, they are returned to Tinkan and the company reimburses the industry 2 for each extra can. These extra cans are put in storage for next year. Each year a can is held in storage, a carrying cost equal to 20% of the cans production cost is incurred. It is well known that the number of salmon harvested during a year is strongly related to the number of salmon harvested the previous year. In fact, using past data, Tinkan estimates that the harvest size in year t, Ht (measured in the number of cans required), is related to the harvest size in the previous year, Ht1, by the equation Ht = Ht1et where et is normally distributed with mean 1.02 and standard deviation 0.10. Tinkan plans to use the following production strategy. For some value of x, it produces enough cans at the beginning of year t to bring its inventory up to x+Ht, where Ht is the predicted harvest size in year t. Then it delivers these cans to the salmon industry. For example, if it uses x = 100,000, the predicted harvest size is 500,000 cans, and 80,000 cans are already in inventory, then Tinkan produces and delivers 520,000 cans. Given that the harvest size for the previous year was 550,000 cans, use simulation to help Tinkan develop a production strategy that maximizes its expected profit over the next 20 years. Assume that the company begins year 1 with an initial inventory of 300,000 cans.arrow_forwardSuppose you currently have a portfolio of three stocks, A, B, and C. You own 500 shares of A, 300 of B, and 1000 of C. The current share prices are 42.76, 81.33, and, 58.22, respectively. You plan to hold this portfolio for at least a year. During the coming year, economists have predicted that the national economy will be awful, stable, or great with probabilities 0.2, 0.5, and 0.3. Given the state of the economy, the returns (one-year percentage changes) of the three stocks are independent and normally distributed. However, the means and standard deviations of these returns depend on the state of the economy, as indicated in the file P11_23.xlsx. a. Use @RISK to simulate the value of the portfolio and the portfolio return in the next year. How likely is it that you will have a negative return? How likely is it that you will have a return of at least 25%? b. Suppose you had a crystal ball where you could predict the state of the economy with certainty. The stock returns would still be uncertain, but you would know whether your means and standard deviations come from row 6, 7, or 8 of the P11_23.xlsx file. If you learn, with certainty, that the economy is going to be great in the next year, run the appropriate simulation to answer the same questions as in part a. Repeat this if you learn that the economy is going to be awful. How do these results compare with those in part a?arrow_forward
- In August of the current year, a car dealer is trying to determine how many cars of the next model year to order. Each car ordered in August costs 20,000. The demand for the dealers next year models has the probability distribution shown in the file P10_12.xlsx. Each car sells for 25,000. If demand for next years cars exceeds the number of cars ordered in August, the dealer must reorder at a cost of 22,000 per car. Excess cars can be disposed of at 17,000 per car. Use simulation to determine how many cars to order in August. For your optimal order quantity, find a 95% confidence interval for the expected profit.arrow_forwardAssume the demand for a companys drug Wozac during the current year is 50,000, and assume demand will grow at 5% a year. If the company builds a plant that can produce x units of Wozac per year, it will cost 16x. Each unit of Wozac is sold for 3. Each unit of Wozac produced incurs a variable production cost of 0.20. It costs 0.40 per year to operate a unit of capacity. Determine how large a Wozac plant the company should build to maximize its expected profit over the next 10 years.arrow_forward
 Practical Management ScienceOperations ManagementISBN:9781337406659Author:WINSTON, Wayne L.Publisher:Cengage,