
(a)
The profit or loss earned by a representative firm when demand is D1.
(a)
Explanation of Solution
Given information:
The price is $25, the quantity produced is 600, and the
The total revenue can be calculated using Equation (1) as follows:
Substitute the respective values in Equation (1) to calculate the total revenue.
The total revenue is $15,000.
The total cost can be calculated using Equation (2) as follows:
Substitute the respective values in Equation (2) to calculate the total cost.
The total cost is $9,000.
The profit or loss earned by a firm is the difference between the total revenue and total cost. The profit or loss of a firm can be calculated using Equation (3) as follows:
Substitute the respective values in Equation (3) to calculate the profit.
The profit of the firm is $6,000.
Figure 1 shows the profit earned by the representative firm.
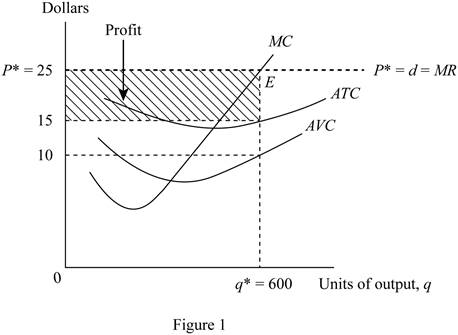
The horizontal axis of Figure 1 measures the quantity of output, and the vertical axis measures the price. The average variable cost curve, average total cost curve, and the marginal cost curve are plotted using the given information. The marginal revenue curve is the same as the demand curve, and the price line as the firm is perfectly competitive. The profit maximizing output is produced at the point E, where the marginal revenue and marginal cost curves intersect. The shaded region in the graph represents the profit earned by the firm. The profit can also be calculated as the area of the shaded rectangular region.
Figure 1 reveals that the equilibrium price per unit is $25, equilibrium quantity is 600 units, and the cost per unit is $15. Thus, profit can be calculated as follows:
Thus, the profit of the firm is $6,000.
Total cost: Total cost is defined as the sum of fixed cost and variable cost.
Total revenue: Total revenue is defined as the total income earned from the sale of output produced.
Profit: Profit is defined as the excess revenue earned over the total cost of production.
(b)
The profit or loss earned by a representative firm when demand is D2.
(b)
Explanation of Solution
Given information:
The price is $15, the quantity produced is 400, and the average total cost is $18.
Substitute the respective values in Equation (1) to calculate the total revenue.
The total revenue is $6,000.
Substitute the respective values in Equation (2) to calculate the total cost.
The total cost is $7,200.
Substitute the respective values in Equation (3) to calculate the profit.
The loss of the firm is $1,200.
Figure 2 shows the loss incurred by the representative firm.
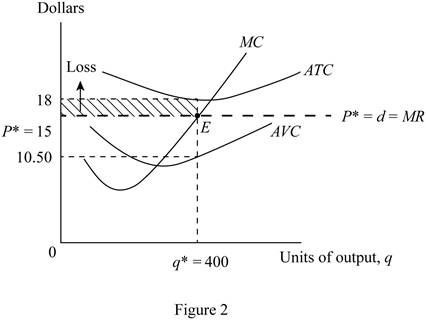
The horizontal axis of Figure 2 measures the quantity of output, and the vertical axis measures the price. The
Figure 2 reveals that the
Thus, the loss incurred is $1,200.
Total cost: Total cost is defined as the sum of fixed cost and variable cost.
Total revenue: Total revenue is defined as the total income earned from the sale of output produced.
Loss: Loss is defined as the excess cost incurred over the total revenue earned.
(c)
The profit or loss earned by a representative firm when demand is D3.
(c)
Explanation of Solution
Given information:
The price is $10, the quantity produced is 300, the average total cost is $21, and the average variable cost is $11..
Substitute the respective values in Equation (1) to calculate the total revenue.
The total revenue is $3,000.
Substitute the respective values in Equation (2) to calculate the total cost.
The total cost is $6,300.
Since the price is less than the average variable cost, the firm would better shutdown.
The loss of the firm is the total fixed cost of the firm. The total fixed cost can be calculated as follows:
The total fixed cost or the loss of the firm is $3,000.
Figure 3 shows the loss incurred by the representative firm.
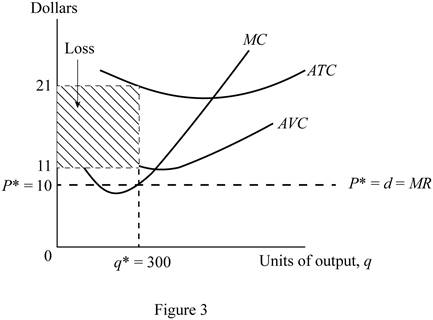
The horizontal axis of Figure 3 measures the quantity of output, and the vertical axis measures the price. The average variable cost curve, average total cost curve, and the marginal cost curve are plotted using the given information. The marginal revenue curve is the same as the demand curve, and the price line as the firm is perfectly competitive. It is evident that the marginal revenue curve is below the average variable cost curve. This loss if the fixed cost of the firm. The shaded region in the graph represents the loss incurred by the firm. The loss can also be calculated as the area of the shaded rectangular region.
Figure 3 reveals that equilibrium price is $11, equilibrium quantity is 300 units, and the cost per unit is $21. Thus, loss can be calculated as follows:
Thus, the loss incurred is $3,000.
Total cost: Total cost is defined as the sum of fixed cost and variable cost.
Fixed cost: Fixed cost is defined as the cost that is independent of the level of output or production of a firm.
Variable cost: Variable cost is defined as the cost that depends on the level of production or output of a firm.
Loss: Loss is defined as the excess cost incurred over the total revenue earned.
Want to see more full solutions like this?
Chapter 9 Solutions
PRINCIPLES OF MICROECONOMICS


 Principles of Economics (12th Edition)EconomicsISBN:9780134078779Author:Karl E. Case, Ray C. Fair, Sharon E. OsterPublisher:PEARSON
 Engineering Economy (17th Edition)EconomicsISBN:9780134870069Author:William G. Sullivan, Elin M. Wicks, C. Patrick KoellingPublisher:PEARSON
 Principles of Economics (MindTap Course List)EconomicsISBN:9781305585126Author:N. Gregory MankiwPublisher:Cengage Learning
 Managerial Economics: A Problem Solving ApproachEconomicsISBN:9781337106665Author:Luke M. Froeb, Brian T. McCann, Michael R. Ward, Mike ShorPublisher:Cengage Learning
 Managerial Economics & Business Strategy (Mcgraw-...EconomicsISBN:9781259290619Author:Michael Baye, Jeff PrincePublisher:McGraw-Hill Education