
the table given and calculate the asked questions.
Concept Introduction:
Rule of 70: It is a numerical formula to determine the time period, that a variable will take to double itself.
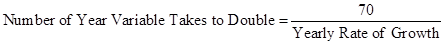
Formula to calculate number of years variable will take to double itself:

Here:
- R is current constant growth rate.
- N is number of year it will take to be double.
Answer to Problem 3P
a. Ratio of per capita GDP in 2012.
i. Middle-income to high-income countries.
Given,
Real GDP of middle-income country in 2015 is $4,584.
Real GDP of high-income country in 2015 is $41,038.
Formula to calculate ratio of per capita GDP of middle-income country to high-income country,
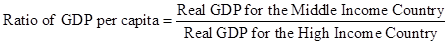
Substitute $4,584 for real GDP for the middle-income country and $41,038 for real GDP for the high-income country.
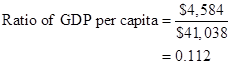
In the given case, ratio of per capita GDP of middle-income country to high-income country is 0.112.
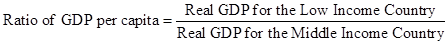
ii. Low-income to high-income countries.
Given,
Real GDP of low-income country in 2015 is $588.
Real GDP of high-income country 2015 is $41,038.
Formula to calculate ratio of per capita GDP of low-income country to high-income country,

Substitute $588 for real GDP for the low-income country and $41,038 for real GDP for the high-income country.
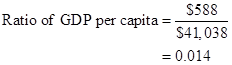
In the given case, ratio of per capita GDP of low-income country to high-income country is 0.014.
iii. Low-income to middle-income countries.
Given:
Real GDP of low-income country in 2015 is $588.
Real GDP of middle-income country in 2015 is $4,584.
Formula to calculate ratio of per capita GDP of low-income country to middle-income country,

Substitute $588 for real GDP for the low-income country and $4,584 for real GDP for the middle-income country.
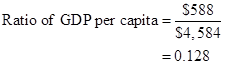
In the given case, ratio of per capita GDP of low-income country to middle-income country is 0.128.
b. Number of years taken by the low income and middle-income countries to double their per capita GDP.
Given,
Growth rate of low-income country is 2.3%.
Growth rate of middle-income country is 4.4%.
Formula to calculate number of year variable takes to double,
 (I)
(I) According to the given case, to double GDP the low-income country and middle-income country will take 30 years and 16 years respectively.
Number of years taken by low-income country to double its GDP.
Substitute 2.3 for yearly rate of growth in (I).
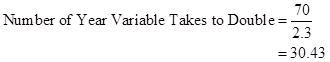
Therefore, to double GDP the low-income country will take 30 years.
Number of years taken by middle-income country to double its GDP.
Substitute 4.4 for yearly rate of growth in (I).
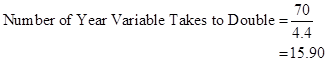
Therefore, to double GDP the middle-income country will take 16 years.
c. Per capita GDP of each of the regions in 2085.
Given,
Growth rate of high-income country is 1.0%.
Growth rate of low-income country is 2.3%.
Growth rate of middle-income country is 4.4%.
Formula to calculate number of year variable takes to double,

Substitute 1.0 for yearly rate of growth in (I).
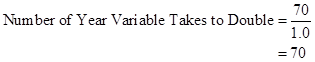
- Therefore, in 70 years, which will be in 2085, GDP per capita of high-income countries will be $82,076

- If per capita GDP is to be projected then middle-income country will double its per capita GDP by 4 times
 Therefore, in 2085 per capita GDP of middle-income country will be $73,344
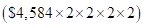
- If per capita GDP is to be projected then low-income country, will double its per capita GDP by 2 times
 Therefore, in 2085 per capita GDP of low-income country will be $2,352
d. Projected per capita GDP in 2085.
Calculated (in part c. ),
Real GDP of low-income country in 2085 is $2,352.
Real GDP of middle-income country in 2085 is $73,344.
Real GDP of high-income country in 2085 is $82,076.
Middle-income to high-income countries.
Formula to calculate ratio of per capita GDP of middle-income country to high-income country,

Substitute $73,344. for real GDP for the middle-income country and $82,076 for real GDP for the high-income country.
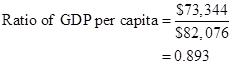
Thus, ratio of per capita GDP of middle-income country to high-income country is 0.893.
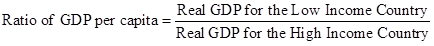
Low-income to high-income countries.
Formula to calculate ratio of per capita GDP of low-income country to high-income country,
Substitute $2,352 for real GDP for the low-income country and $82,076 for real GDP for the high-income country.
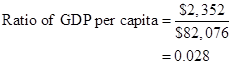
Thus, ratio of per capita GDP of low-income country to high-income country is 0.028.
Low-income to middle-income countries.
Formula to calculate ratio of per capita GDP of low-income country to middle-income country,
Substitute $2,352 for real GDP for the low-income country and $73,344 for real GDP for the middle-income country.
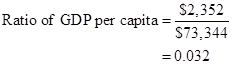
Thus, ratio of per capita GDP of low-income country to middle-income country is 0.032.
e. Comparison of part a. and part d.
According to the data calculated in the above parts the inequality between low-income countries and middle-income countries will increase with time.
Explanation of Solution
- According to the calculated data, per capita GDP of low-income country and middle-income country have improved but per capita GDP of high-income country has not improved that much.
- According to the calculated data, the growth middle-income countries are so fast that its growth in 2085 will surpass the present high-income countries growth.
- The middle-income is growing at much faster rate as compared to low-income countries. Therefore, the inequality between low-income countries and middle-income countries will increase.
Want to see more full solutions like this?


 Principles of Economics (12th Edition)EconomicsISBN:9780134078779Author:Karl E. Case, Ray C. Fair, Sharon E. OsterPublisher:PEARSON
 Engineering Economy (17th Edition)EconomicsISBN:9780134870069Author:William G. Sullivan, Elin M. Wicks, C. Patrick KoellingPublisher:PEARSON
 Principles of Economics (MindTap Course List)EconomicsISBN:9781305585126Author:N. Gregory MankiwPublisher:Cengage Learning
 Managerial Economics: A Problem Solving ApproachEconomicsISBN:9781337106665Author:Luke M. Froeb, Brian T. McCann, Michael R. Ward, Mike ShorPublisher:Cengage Learning
 Managerial Economics & Business Strategy (Mcgraw-...EconomicsISBN:9781259290619Author:Michael Baye, Jeff PrincePublisher:McGraw-Hill Education