
Concept explainers
Videos
Deduce the structure of the compound that gives the following
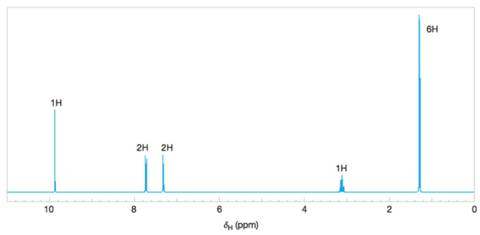
Figure 9.43 The
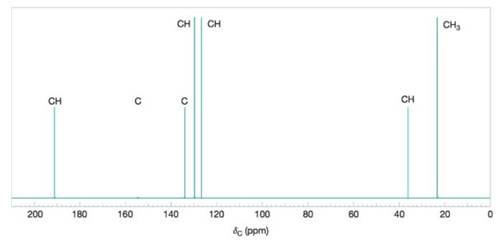
Figure 9.44 A simulated broadband proton-decoupled
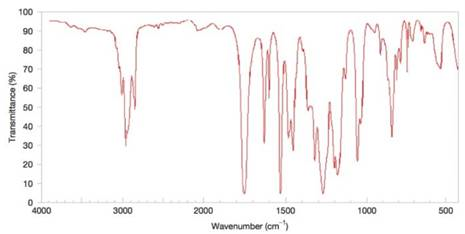
Figure 9.45 The IR spectrum for Problem 9.41. (SDBS, National Institute of Advanced Industrial Science and Technology)
Want to see the full answer?
Check out a sample textbook solution
Chapter 9 Solutions
ORGANIC CHEMISTRY (LL) W/WILEYPLUS NEXT
Additional Science Textbook Solutions
Chemistry: The Molecular Nature of Matter
Chemistry & Chemical Reactivity
Living By Chemistry: First Edition Textbook
Introductory Chemistry (5th Edition) (Standalone Book)
Chemistry For Changing Times (14th Edition)
The Organic Chem Lab Survival Manual: A Student's Guide to Techniques


- Find how many peaks will appear in the proton (1H) NMR spectrum and carbon (13C) NMR spectrum of each molecue. Don't take into account splitting in the proton(1H) NMRarrow_forward(3) These natural compounds will have different numbers of 1H-NMR signals in different NMR solvents like CDC13 and methanol-d4. How many signals do you anticipate for each compound respectively in CDC13 and methanol-d4? LOCH 3 OHC. vanillin OH LOH acetoaminophen HO thymolarrow_forwardAn unknown compound has the formula C3H7NO2. Elucidate its structure by scrutinizing its 1H NMR spectra, shown. Specifically, label each different type of H atom in the final structure with its NMR chemical shift in ppm.arrow_forward
- Predict the structure of the compound using the information below. Kindly show what information are obtained for each spectra which may help in predicting the structure. From IR Spectra: See the attached picture From Mass Spectra M+ = 87 From Proton and Carbon NMR Spectra See attached picture.arrow_forwardBelow are the ¹H NMR spectrum of triphenylmethanol, benzophenone, and bromobenzene. Identify the compound corresponding to each ¹H NMR spectrum and draw the structure next to the ¹H NMR spectrum. Assign ALL peaks in each of the three ¹H NMR spectra. Hint: Conjugated systems (benzophenone) including an electronegative atom will cause a more downfield shift of ring protons in ¹H NMR compared with non-conjugated systems (bromobenzene). 8 8 8 7 7 7 6 6 6 5 5 5 4 PPM 4 PPM 4 PPM 3 3 3 2 2 2 1 1 1 0 0 0arrow_forwardHow many peaks would appear in the ¹3C NMR spectrum of this compound?arrow_forward
- Part C Look at the NMR spectrum and list the structural characteristics you can determine from that spectrum. 200 180 160 140 120 100 80 60 40 20 13C NMR (CH, (CH, (CH) |(CH) CDCI (CH) (C) SOH SOH 7.18 708 6.18 6.08 CHCI, 10 8 (ppm) Part D Look at the set of spectra as a group and propose a structure the compound.arrow_forwardDetermine the structure of the unknown compound using the following information. Please show what information are deduced for each spectra which can help predict the structure. From IR Spectra: See the attached picture. From Mass Spectra M+ = 162 base peak = 147 peaks at 43 and 91 From Proton and Carbon NMR Spectra See attached picture.arrow_forwardPredict how many peaks you would expect to observe in the ‘H NMR,spectrum of the compound shown below and indicate the integration value you would expect to see for each peak. Please explain how you got the answer. (It may be useful to label each hydrogen atom using lowercase letters).arrow_forward
- An unknown compound has the molecular formula C7H14O, and its 1H NMR and 13C NMR spectra are shown here. Determine the structure of the unknown compound and draw it below. Note that there are no peaks above 3 ppm in the 1H NMR, and the numbers present on the 1H NMR are the integration values for each set of peaks. (Also note that the protons responsible for causing the splitting pattern seen for the "9 peak" multiplet have similar coupling constants.)arrow_forwardFollowing are the 'H and 13C NMR spectra for each of three isomeric ketones with formula C7H14O. Determine a structure to each pair of spectra and assign each H and C. Carbon spectrum А C,H140 Carbon spectrum В C;H140 CDCI3 200 150 100 50 Proton spectrum CDC13 A C,H140 200 150 100 50 1.96 2.00 2.91 3.0 2.5 2.0 1.5 1.0 0.5 0.0 211.04 -44.79 –17.39 – 13.78 -218.40 - 38.85 –18.55arrow_forwardDetermine the structure from the FTIR and mass spectrum. The proton NMR has a singlet with an integration of 6 hydrogens at 2.6 ppm, a triplet with an integration of 1 hydrogen at 7.41 ppm, and a doublet with an integration of 3 hydrogens at 7.25 ppm.arrow_forward

 Organic ChemistryChemistryISBN:9781305580350Author:William H. Brown, Brent L. Iverson, Eric Anslyn, Christopher S. FootePublisher:Cengage Learning